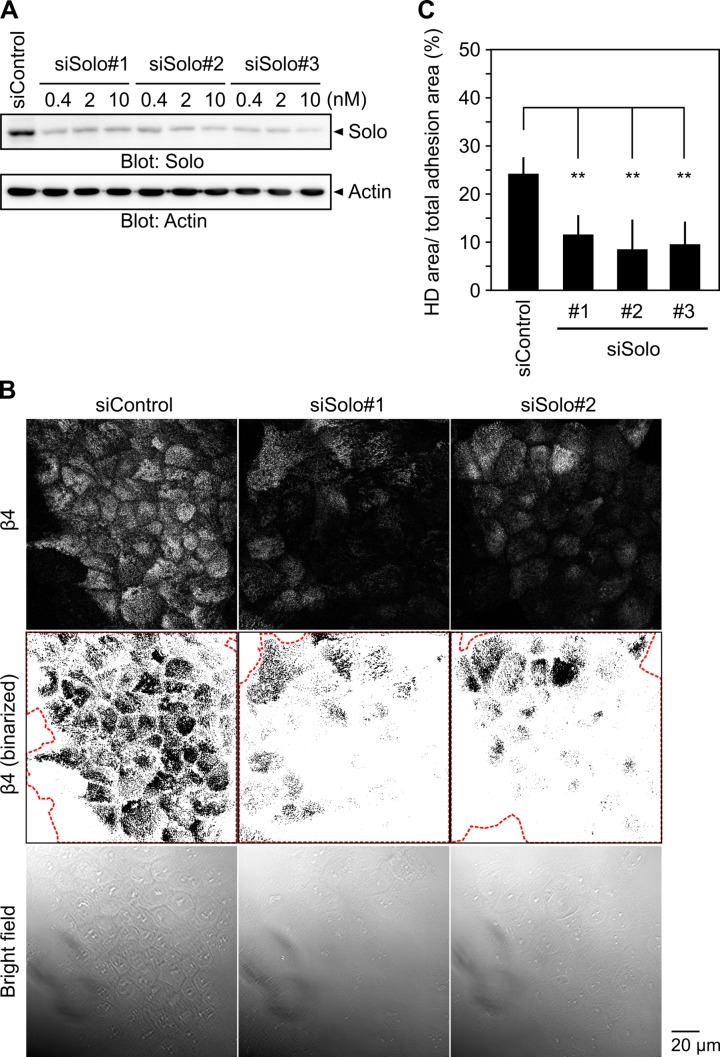
Fig 2. Knockdown of Solo suppresses hemidesmosome formation.
(A) Effects of Solo-targeting siRNAs on Solo expression. MCF10A cells were transfected with control or Solo-targeting siRNAs at the indicated concentrations of siRNAs and cultured for 48 h. Cell lysates were analyzed by immunoblotting with an anti-Solo antibody. (B) Ventral images of endogenous β4, their binary images, and bright field images of control and Solo knockdown MCF10A cells. Cells were seeded on a thin Matrigel-coated coverslip, transfected with control or Solo-targeting siRNAs, and cultured for 48 h. The red dotted lines indicate the total adhesion area defined by bright field images. Scale bar, 20 μm. (C) Quantitative analysis of the effect of Solo knockdown on HD formation. The ratio of HD area (measured from the binary image of β4) to total adhesion area (measured from the bright field image) was calculated. Data represent the means ± SD of 4 independent experiments (at least 5 images per experiment). **P < 0.01 (one-way ANOVA followed by Dunnett's test).

