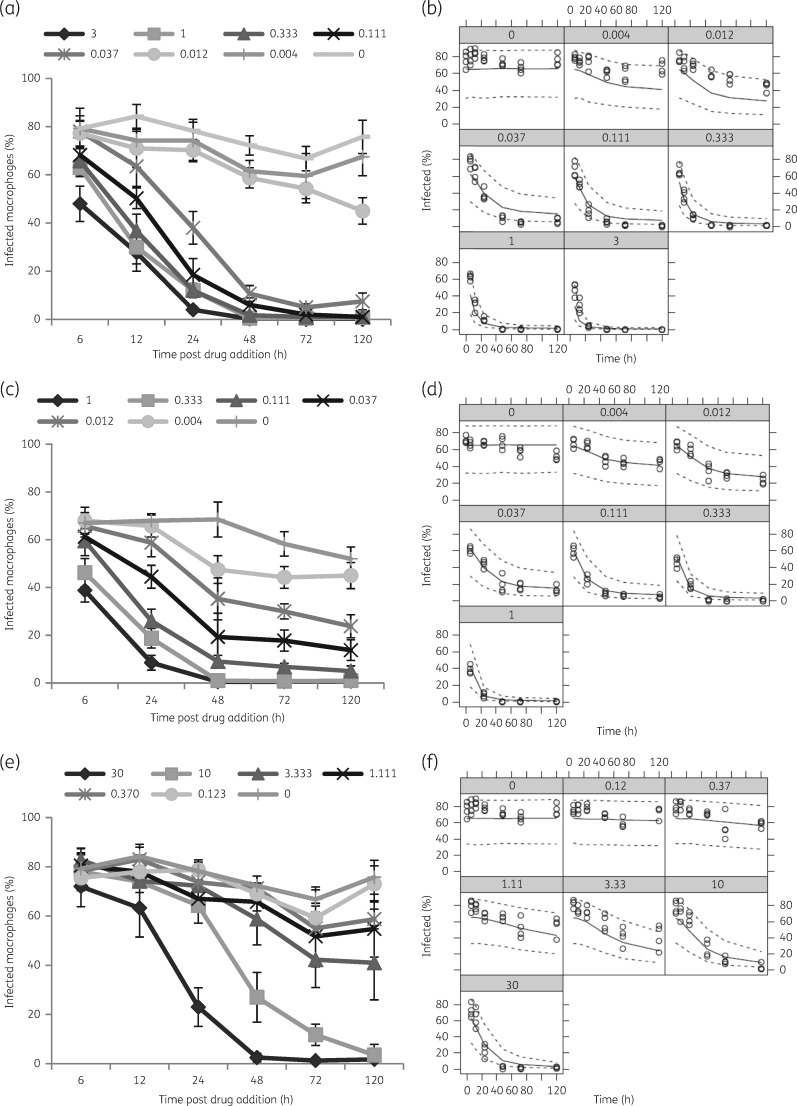
Figure 1.
Time–kill curves for amphotericin B and miltefosine. BMDMs were infected with L. donovani (MHOM/Sudan/09/SUKA001) and exposed to Fungizone® (a and b), AmBisome® (c and d) or miltefosine (e and f) at indicated drug concentrations (µM). The percentage of infected macrophages was evaluated at the indicated timepoints. Visual predictive checks, for respective experiments, comparing the percentage of infected cells (black open circles) with model-simulated 2.5th, 50th and 97.5th percentiles of 1000 simulated datasets are shown (b, d and f). Data are shown for one of five separate experiments for miltefosine, six separate experiments for Fungizone® and three separate experiments for AmBisome®.

