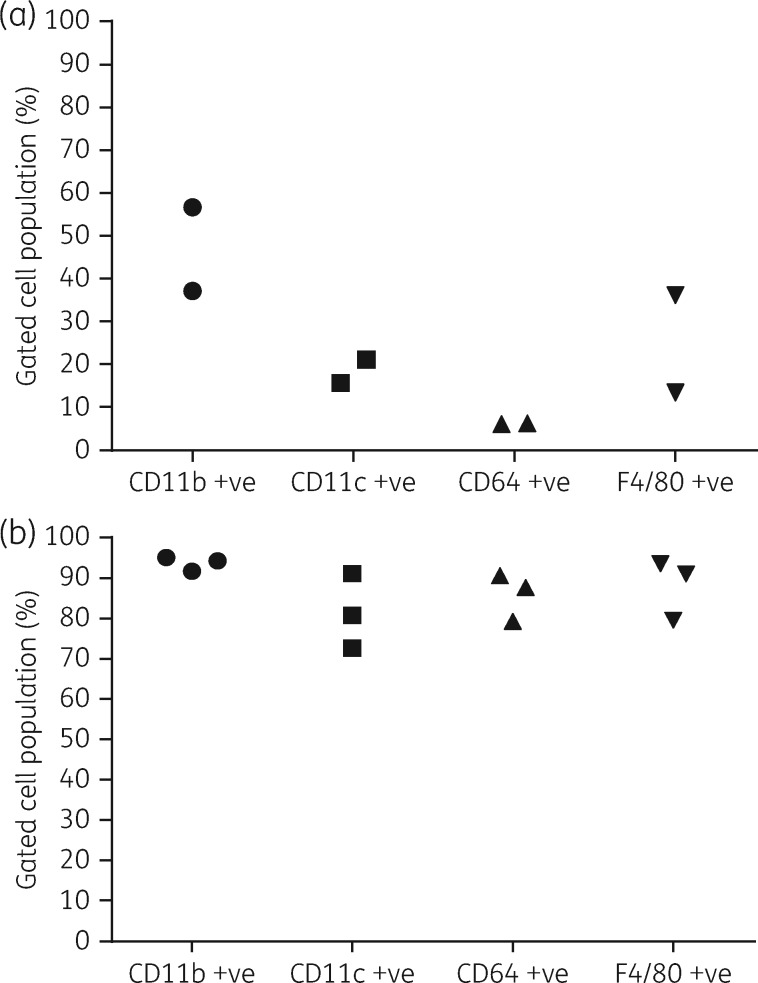
Figure 2.
Expression levels of different surface markers on PECs and BMDMs. Each data point represents the average percentage of gated cell populations (n = 4) for indicated markers in separate experiments in PECs (a) and BMDMs (b). Standard deviations were ≤1.5 for PECs and ≤4.4 for BMDMs and, thus, they are not shown in the plots. The percentages of live cells in repeat experiments were 79.2 ± 4.4% and 79.3 ± 5.3% in PECs and 85.7 ± 0.8% and 89.8 ± 2.0% in BMDMs.

