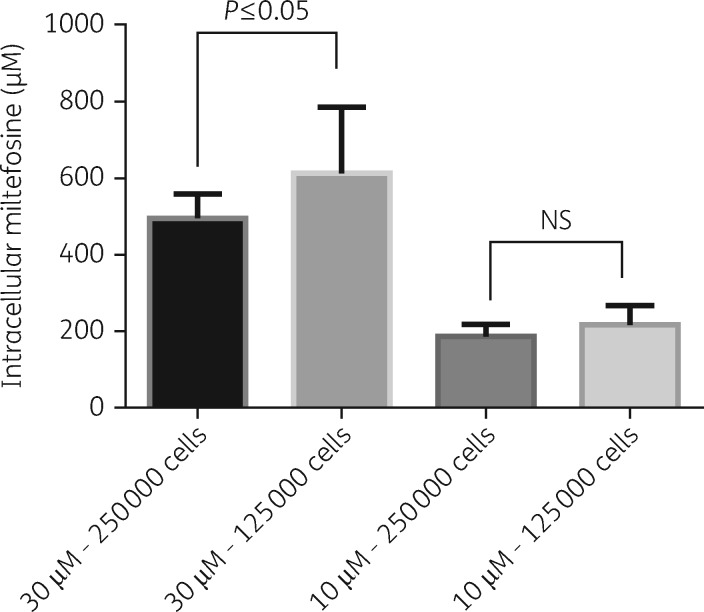
Figure 8.
Effect of host cell numbers on cell-associated miltefosine. Columns represent the means (n = 8) and the error bars represent the standard deviations. Data are shown as combined data from two separate experiments. Statistical significance, defined as P < 0.05, was evaluated by one-way analysis of variance, assuming Gaussian distribution, and Sidak’s multiple comparisons test (GraphPad Prism 6). NS, non-significant.

