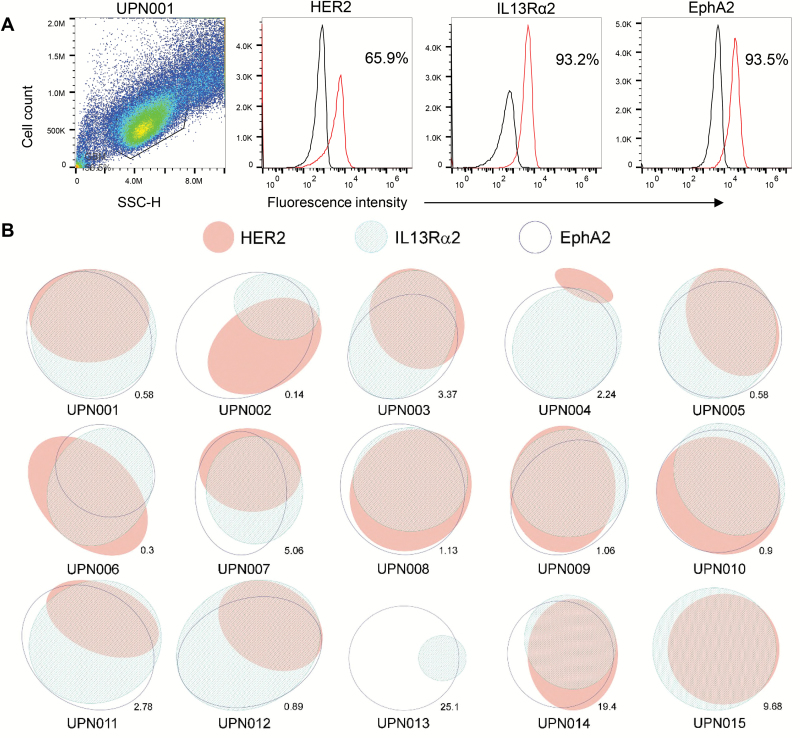
Fig. 1.
Antigen expression pattern of HER2, IL13Rα2, and EphA2 for 15 primary patient GBM samples. Patient tumor samples were co-stained for all 3 antigens, and ≥100000 primary GBM cells were simultaneously interrogated using flow cytometry. (A) Sample of flow cytometry histograms for patient UPN001. (B) Euler diagrams with ellipsis representing the percentage of cells in patient tumor expressing each antigen. Areas of overlap indicate percentage of cells expressing multiple antigens.

