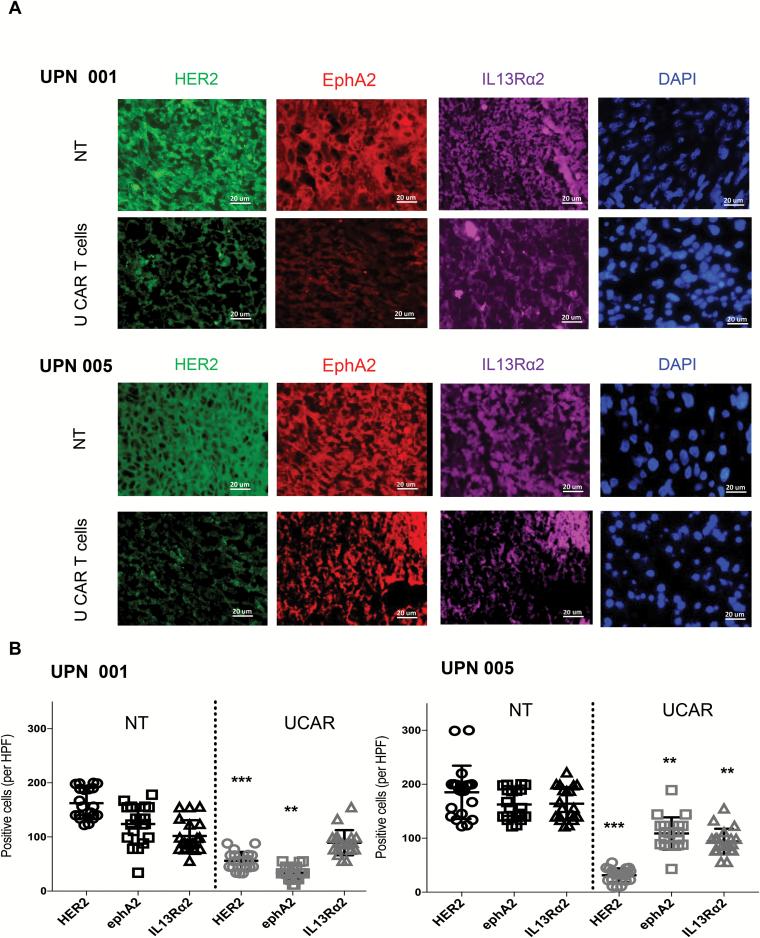
Fig. 6.
(A) Characterization of UPN001 and UPN005 xenografts post treatment from frozen mouse brain sections. GBM tumor xenografts of mice (N = 3) from the NT and UCAR T-cell treated groups were characterized post treatment using immunofluorescence staining for HER2 (green), EphA2 (red), and IL13Rα2 (purple), DAPI (blue), at 40x magnification. Representative images shown. Scale bar = 20 µm. (B) Dot plots representing HER2, EphA2, and IL13Rα2 positively stained cells in brain sections of mice quantified collectively from 20 high power fields in each group using ImageJ. **P < 0.01 and ***P < 0.001.

