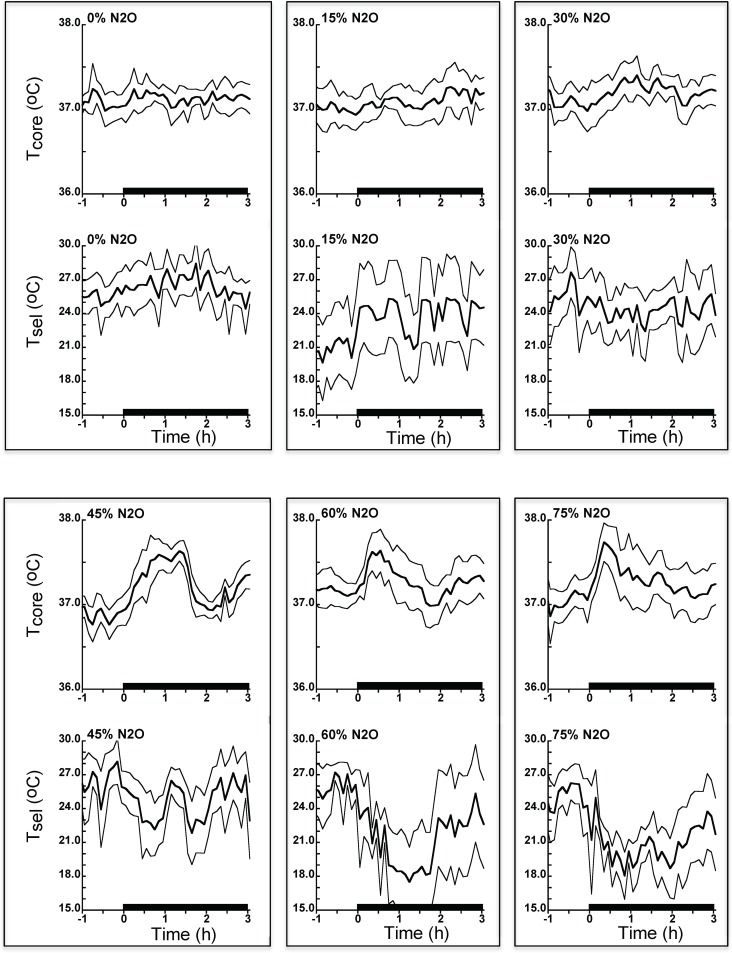
Fig 4. Time series plots of core temperature and selected ambient temperature during a single nitrous oxide exposure in the thermally graded alleyway following 12 drug administrations in the calorimetry phase of the study.
Despite access to ambient temperatures that presumably would have prevented hyperthermia (8°C at the coldest end), rats in the higher dose groups selected only modestly lower temperatures and still developed hyperthermia in the earlier part of administration. N = 12 per group. Data are mean ± 95% confidence limits. Tcore, core temperature; Tsel, selected ambient temperature; N2O, nitrous oxide.

