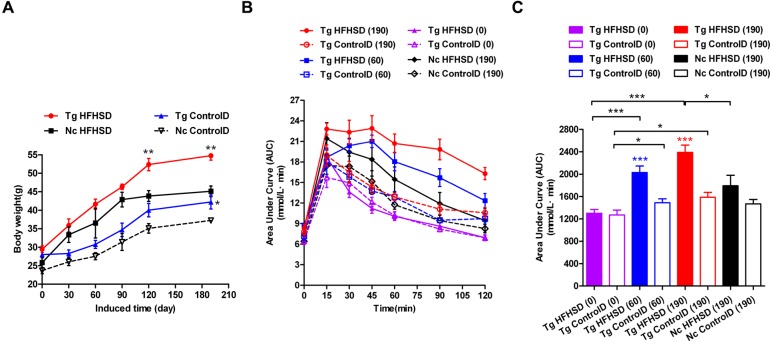
Figure 3. Body weights and IPGTT data indicating insulin resistance of triple-transgenic mice.
(A) The increasing weight trends of triple-transgenic mice during the induction period (the induction period lasted for 190 days and was started when the mice were 13 weeks of age. Tg HFHSD (red), 11β-HSD1-CHOP-hIAPP triple-transgenic mice with HFHS diet induction; Tg ControlD (blue), triple-transgenic mice fed a control diet; Nc HFHSD (black), negative control mice with HFHS diet induction; Nc Control D (white), negative control mice fed a control diet. ** p < 0.01 vs Nc HFHSD group; * p < 0.05 vs Nc ControlD group; n = 3–6. (B) IPGTT dynamic trends of triple-transgenic mice under HFHS diet induction. The checkpoints include induction for 0 days, 60 days and 190 days. The results for the Nc HFHSD group and the Nc ControlD group at 190 days of induction are included as negative references. n = 4–6 (C) The area under the curve (AUC) of (B). The data are presented as the mean ± SEM. Significance levels are indicated by * p < 0.05, ** p < 0.01 and *** p < 0.001. P values were calculated using Student’s t-test.

