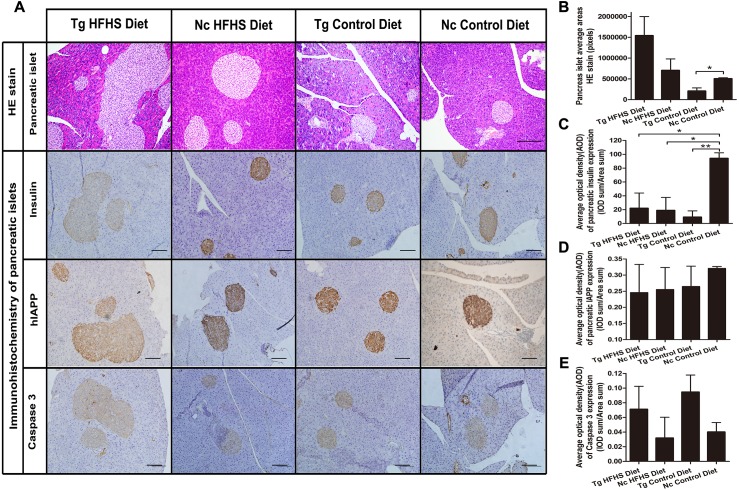
Figure 6. Pathology of pancreatic islets of Langerhans.
(A)Hematoxylin-eosin (HE) staining of pancreatic islets of animals in the four groups. Magnification: 200×. Scale bar = 150 µm. Immunohistochemistry of pancreatic islets for insulin, IAPP and caspase 3. All sections were obtained from the pancreatic tail. Tg: n = 5; Nc: n = 3–6. Magnification: 200×. Scale bar = 100 µm. (B) The pancreatic islet average areas (sum pixels of each) from the four groups were calculated. (C–E) The AODs include pancreatic insulin expression density (C); total IAPP expression density (D); and caspase 3 expression density (E). The significance levels are * p < 0.05 or ** p < 0.01. P values were calculated using Student’s t-test.

