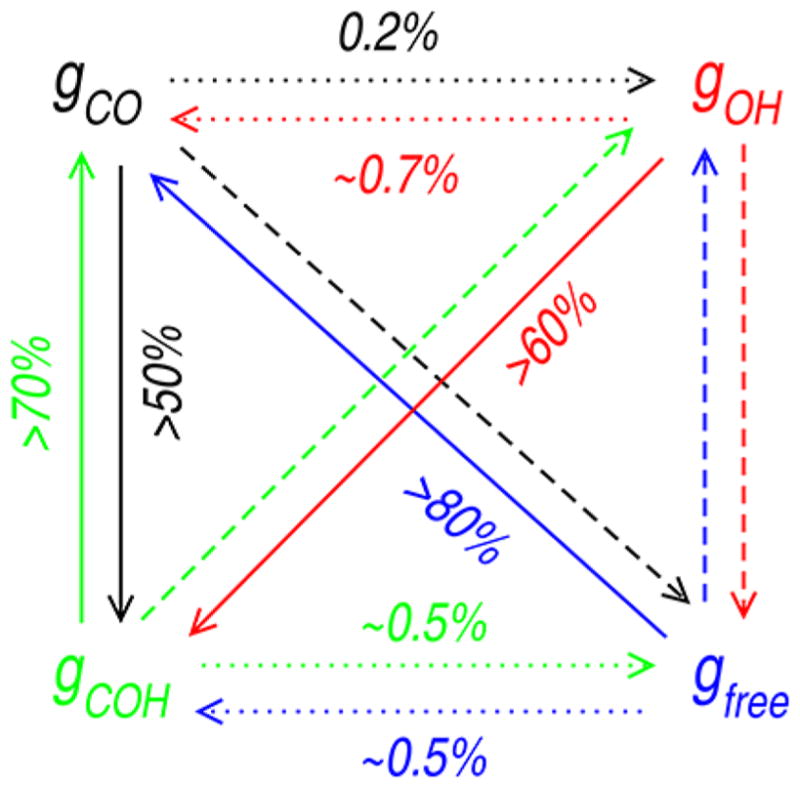
Figure 8.

Schematic representation of probability of conversion of backbone CO from one group to another. Probability is at a maximum for the solid line and at a minimum for the dotted line. For details, see Table SI–V.

Schematic representation of probability of conversion of backbone CO from one group to another. Probability is at a maximum for the solid line and at a minimum for the dotted line. For details, see Table SI–V.