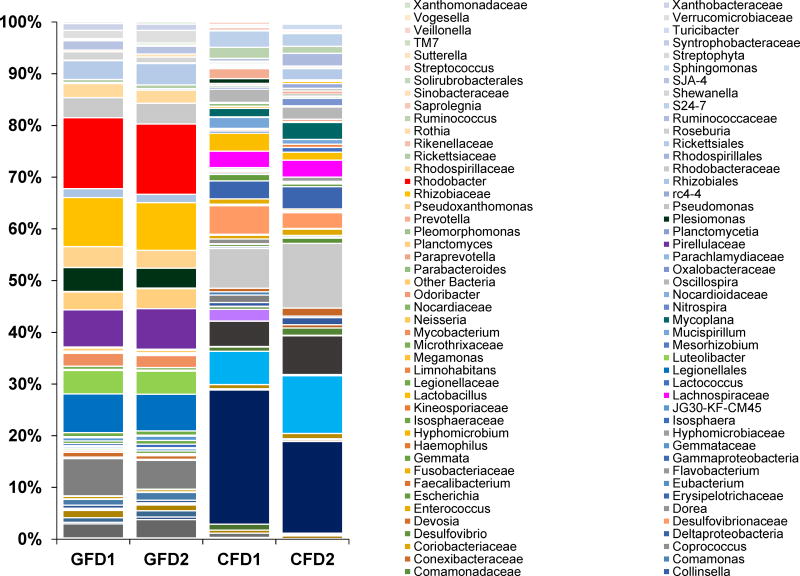
Fig. 1. Stacked column bar graph showing the distribution and abundances of bacterial communities in D. rerio fed with control formulated diet (CFD) and gluten formulated diet (GFD).
The figure shows the relative abundances that were analyzed using QIIME (v1.8.0), and the graph was generated using Microsoft Excel software (Microsoft, Seattle, WA) (GFD1 and GFD2 = Gluten formulated diet sample 1 and 2; CFD1 and CFD2 = Control formulated diet sample 1 and 2).

