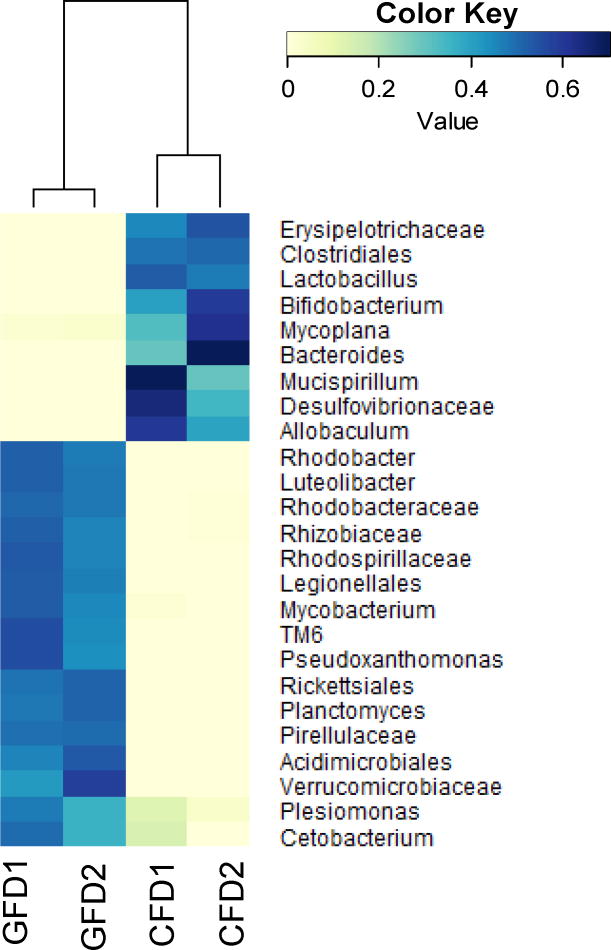
Fig. 3. Heatmap showing the gut microbial compositions at the family level of D. rerio fed with control formulated diet (CFD) and gluten formulated diet (GFD).
The heatmap was generated based on the SIMPER (similarity percentages procedure) result, which represents the contribution of each taxon of the D. rerio gut samples. The SIMPER analysis and heatmap visualization were performed using the vegan package of R statistical software. (GFD1 and GFD2 = Gluten formulated diet sample 1 and 2; CFD1 and CFD2 = Control formulated diet sample 1 and 2).

