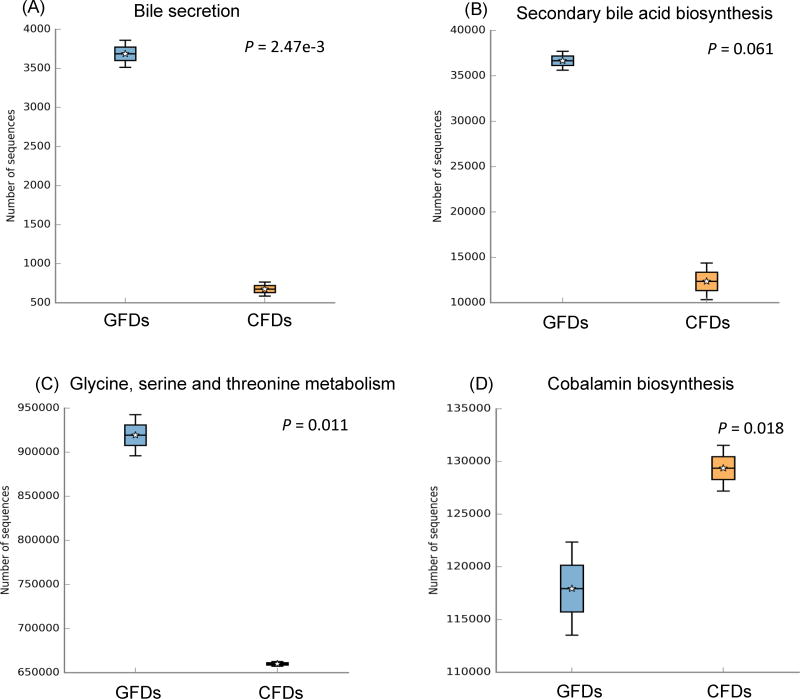
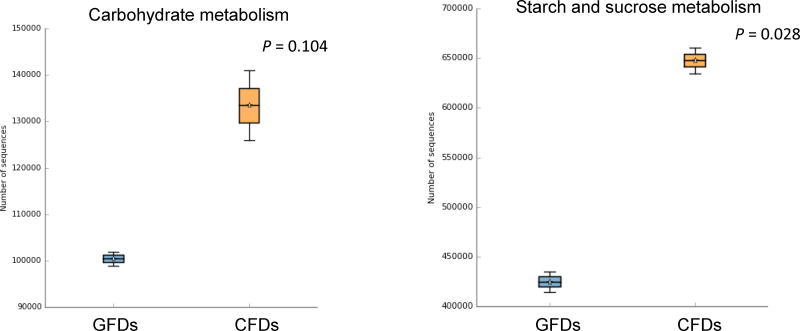
Fig. 4. Box-plot showing the predictive functions of bacterial communities in D. rerio fed with control formulated diet (CFD) and gluten formulated diet (GFD).
The plot was generated from the STAMP analysis based on the PICRUSt results. For group comparison, Welch’s t-test was used to calculate variance between the two groups (i.e. CFD and GFD). The P-value for the total variance of the two groups is listed in the Box-plots. (GFDs = Gluten formulated diet sample 1 and 2; CFDs = Control formulated diet sample 1 and 2).


