
Figure 4. Improved prediction of protein-protein binding energies with explicit solvation.
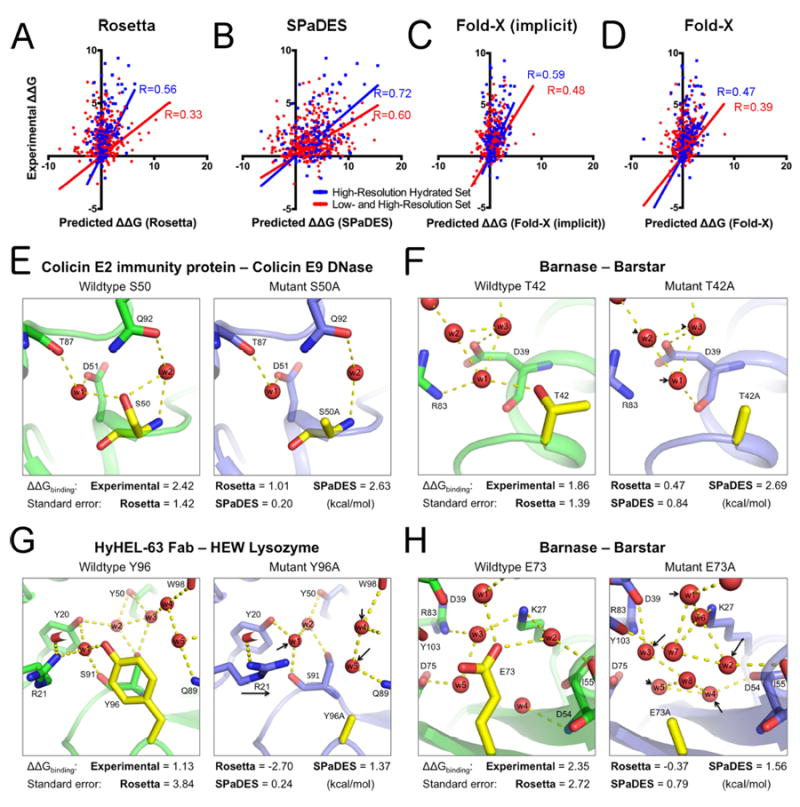
(A-D) Correlations between experimentally determined mutation-induced free energy changes of protein binding ΔΔGbinding and predicted values using Rosetta (A), SPaDES (B), Fold-X with implicit solvation (Fold-X implicit) (C), and Fold-X with explicit water molecule modeling (Fold-X) (D). Correlations are calculated for the high-resolution hydrated set of mutations selected near an experimentally determined water molecule (blue) and the high- and low-resolution set (red) of protein-protein complexes with the best linear correlation fit constrained to pass through the origin as a reference state (methods). Predicted ΔΔGbinding on the x-axis are in Rosetta Energy Units for Rosetta and SPaDES and kcal.mol-1 for the Fold-X results while the experimental ΔΔGbinding on the y-axis are all in kcal.mol-1. Pearson correlation coefficients R are color-coded and reported on each respective panel. (E-H) Examples of improved predictions of mutational effects on protein binding. Green: wild-type protein predicted structure; Blue: mutant protein predicted structure; red sphere: predicted water molecule; yellow: mutated amino-acid; dotted line: strong hydrogen bond (<-0.5 REU). Black arrow: mutation-induced shift in the position of a water molecule or side-chain conformation. (E-H) Experimentally determined and predicted ΔΔGbinding and standard errors of the predictions. (E) S50A mutant of the colicin E2 immunity protein complexed with the colicin E9 DNase. (F) T42A mutation for barnase bound to barstar. (G) Y96A mutation for HyHEL-63 Fab bound to HEW lysozyme. (H) E73A mutation for barnase bound to barstar. Overall and hydrogen bond energetics are described in Table S4. ΔΔGbinding are reported in kcal.mol-1 for both predicted and experimental values. Predicted values in Rosetta Energy Units were translated into kcal.mol-1 using the slope of the best linear correlation fit between predicted and experimental values (Table S3, S5). See also Table S3-S5.