
Figure 5. High-resolution prediction of solvated transmembrane regions in G protein-coupled receptor homology models.
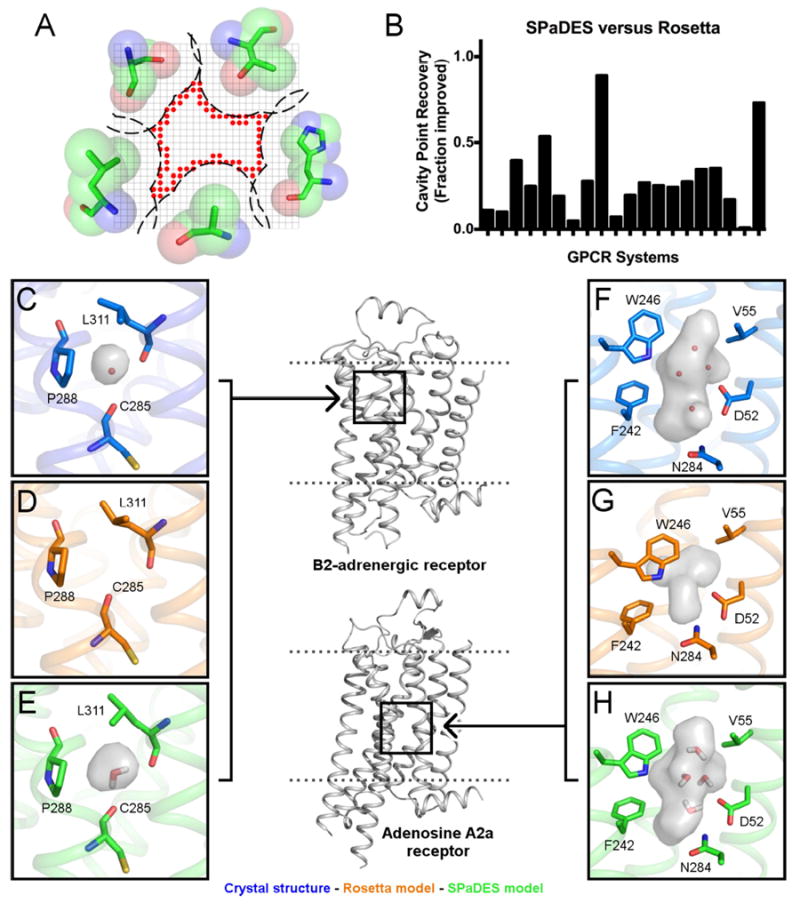
The structures of twenty GPCRs were modeled starting from distant homologs (sequence identity between 20 and 40%) using RosettaMembrane implemented with either the implicit membrane solvation model or the hybrid solvation model of SPaDES. (A) Schematic representation of the grid-based metric calculating the geometry of the hydrated cavities. Red sphere: cavity lattice point. (B) Recovery of cavity lattice points was used to determine the fraction improvement of SPaDES predictions over Rosetta for each system (p<0.001, Student’s t-test). (C-H) Accurate prediction of hydrated cavities and buried solvent molecules in the TM core of the beta 2 adrenergic receptor modeled from the adenosine A2A receptor (E) and the adenosine A2A receptor modeled from the beta 1 adrenergic receptor (H). These cavities are mostly lost when modeled using Rosetta (D, G). The positions of the water molecules observed in the X-ray structures (C, F) are predicted accurately (E, F). The cavities are shown as gray surfaces, neighboring side-chains that affect the cavity shape are shown in sticks with text labels, and water molecules predicted by SPaDES are shown as red sticks in (E). Panels have been rotated to show all marked components. See also Figure S3-S4, Table S5.