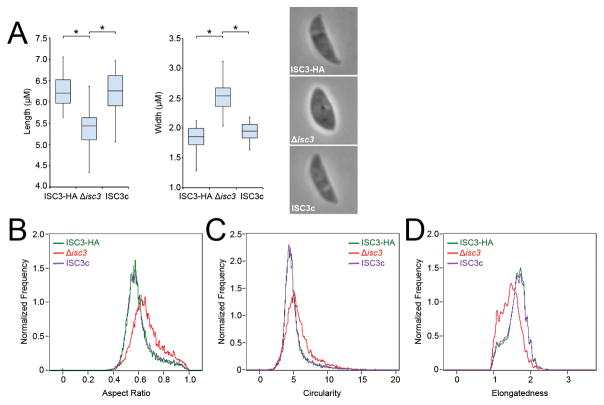
Figure 7. Analysis of extracellular Δisc3 parasite morphology.
A) Measurements of the length and width of extracellular ISC3-HA, Δisc3, or ISC3c parasites. Representative images of each parasite line are shown. Loss of ISC3 results in shorter and wider parasites, a phenotype that is rescued by complementation. Parasite lengths and widths are depicted as box-whisker plots, with the middle lines corresponding to the median, the bottom and top boxes representing the 25th and 75th percentiles, respectively, and whiskers corresponding to the smallest and largest measurements. Data were analyzed by one-way ANOVA followed by Bonferroni post hoc tests. *p<0.001 B-D) ImageStream flow cytometry analysis of extracellular ISC3-HA, Δisc3, or ISC3c parasite morphology using aspect ratio (B), circularity (C), and elongatedness (D) parameters. Aspect ratio measures the ratio of the transverse to longitudinal axis of a cell and more circular cells will have an aspect ratio value closer to 1. Circularity measures the average distance of the cell boundary from its center, divided by the variation of this distance; more circular cells have a lower variation and thus a higher circularity value. Elongatedness measures the ratio of height to width of a cell’s bounding box; long and narrow cells have a higher elongatedness value. Δisc3 parasites (red) display a shift towards higher values of aspect ratio (B) and circularity (C) and lower values of elongatedness (D) compared to parental ISC3-HA parasites (green). These shifts are completely reversed in the ISC3c strain (purple). At least 10,000 images were analyzed for each parasite line.

