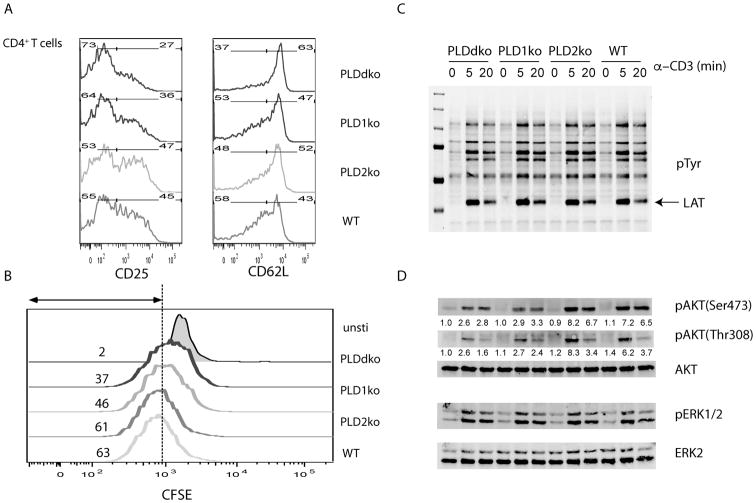
Figure 4. PLD-deficiency on T cell activation and TCR signaling.
(A) Representative flow analysis of CD25 and CD62L. Splenocytes were activated with anti-CD3ε for 20 hours before analysis. (B) CFSE dilution in CD4+ T cells after anti- CD3ε stimulation for 2 days. (C) Biochemical analysis of TCR-mediated signaling pathway. Purified CD4+ T cells were stimulated with biotin-anti-CD3ε and anti-CD28, followed by streptavidin crosslinking for different time points. Cell lysates were analyzed by Western blotting with antibodies against pTyr, pAKT(Ser473), pAKT(Thr308), and pERK1/2 (Thr202/Tyr204). AKT and ERK proteins were normalized by reblotting with anti-AKT and ERK2 antibodies respectively. The numbers shown are relative intensities for the phosphorylated form of proteins normalized to total proteins. Data are representative of three independent experiments.

