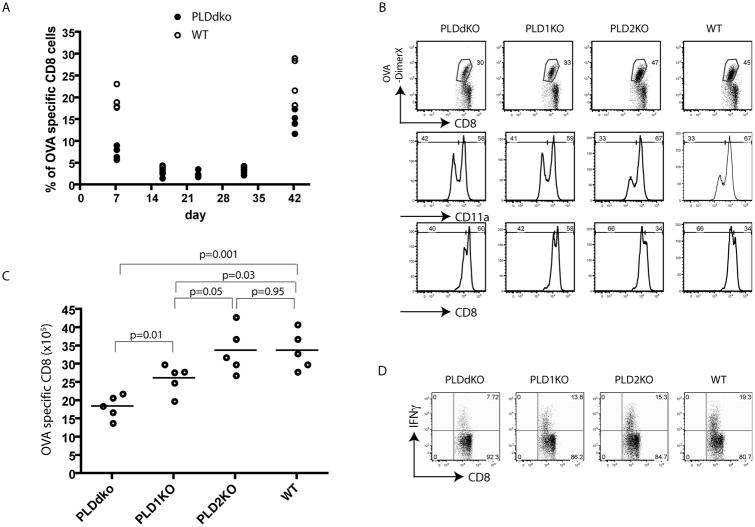
Figure 6. Secondary CD8 T cell response in PLD-deficient mice.
Mice were infected i.v. with 1.5 × 10⁴ Lm-OVA at day 0, and challenged with 1.5 × 10⁵ Lm-OVA at day 37. (A) Kinetics of OVA-specific CD8+ T cell response in PLDdKO and WT mice. Representative plots of OVA-specific CD8+ T cells in the blood from infected mice. (B) OVA-specific T cells after challenge. At day 5 after reinfection, splenocytes were stained with OVA-DimerX, CD11a, and CD8 and analyzed by flow cytometry. (C) The number of OVA-specific CD8+ T cells in the spleen at day 5 after Lm-OVA reinfection. Data are shown as mean ± SEM. (D) IFNγ production by CD8+ T cells. Splenocytes were restimulated with 1μM OVA peptide for 5 hours in the presence of Monensin before intracellular staining. Data are representative of three independent infections.

