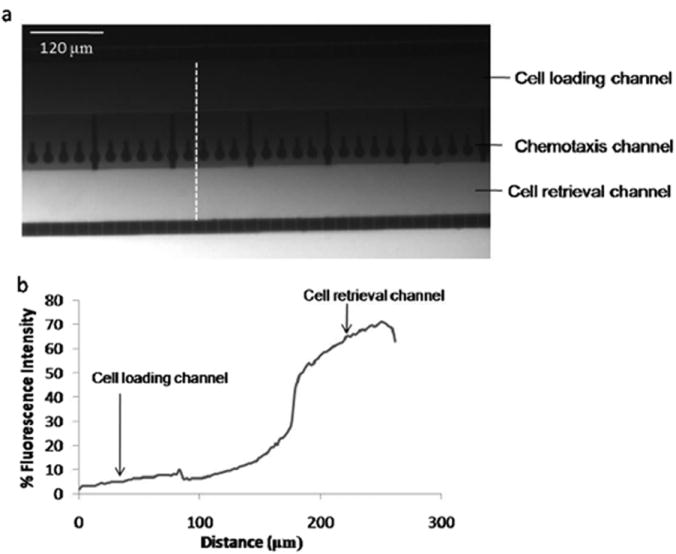
Fig. 2.

Gradient formation in the chemotaxis compartment. (a) Fluorescence micrograph illustrating concentration gradient across the chemotaxis compartment. PBS with or without FITC dextran was continuously flushed through the outer side channels using the syringe pump. (b) Quantified fluorescence intensity across the cross section (white line in Fig 2a) of the chemotaxis compartment. The intensity was normalized based on the fluorescence level in the outer side channels containing PBS with (100%) or without (0%) FITC dextran.
