Fig. 4.

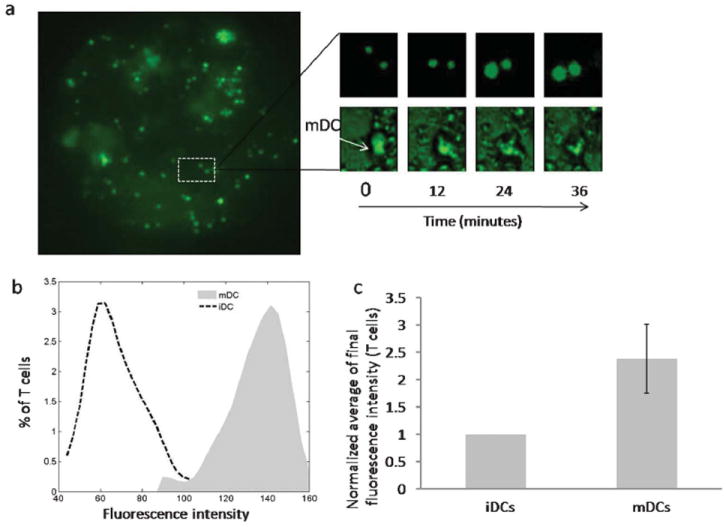
T cell activation by DCs in the T cell compartment. (a) Fluorescence image of the T cell compartment loaded with mDCs and fluorescently labeled T cells. The top inset shows time lapse images depicting temporal increase in the fluorescence of T cells. The bottom inset shows corresponding time lapse images depicting location of the mDC. (b) Final fluorescence intensity distribution of T cells interacting with mDCs or iDCs in the T cell compartment. (c) Normalized average of the final fluorescence intensity of T cells interacting with mDCs or iDCs.
