
Fig. 4.
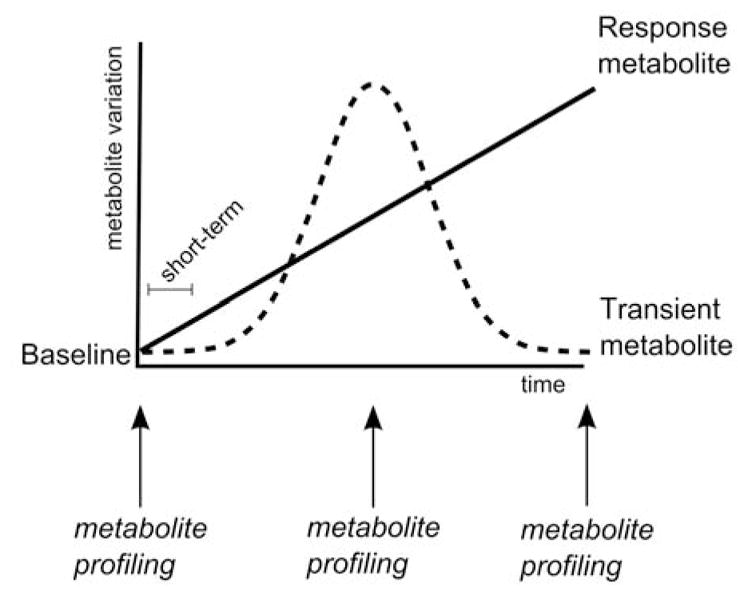
Model for interpretation of three distinct effect phases that may occur during a dietary intervention study, and that can be observed via metabolomic profiling.
Official websites use .gov
A
.gov website belongs to an official
government organization in the United States.
Secure .gov websites use HTTPS
A lock (
) or https:// means you've safely
connected to the .gov website. Share sensitive
information only on official, secure websites.
Model for interpretation of three distinct effect phases that may occur during a dietary intervention study, and that can be observed via metabolomic profiling.