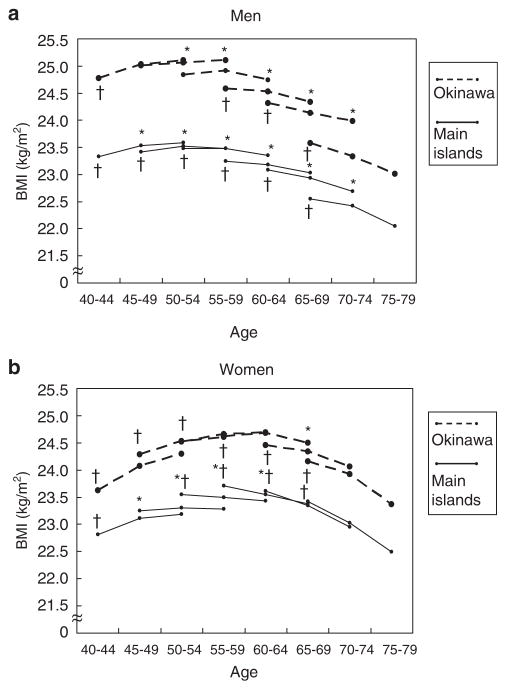
Figure 2.
Changes in mean body mass index in men (a) and in women (b) during a 10-year follow-up period. Each line shows the changes of mean body mass index (BMI) during the 10-year period for each birth cohort stratified by sex, region and age at baseline. Age effect on BMI for each birth cohort was tested using a random effects model (*denotes P<0.05). Cohort effect on BMI for each age category was tested using the linear regression analysis (†denotes P<0.05). Values for s.d. for BMI ranged between 2.6 and 3.3 for men and 2.9 and 3.7 for women. Reprinted by permission from Macmillan Publishers Ltd: Matsushita et al. (2008).

