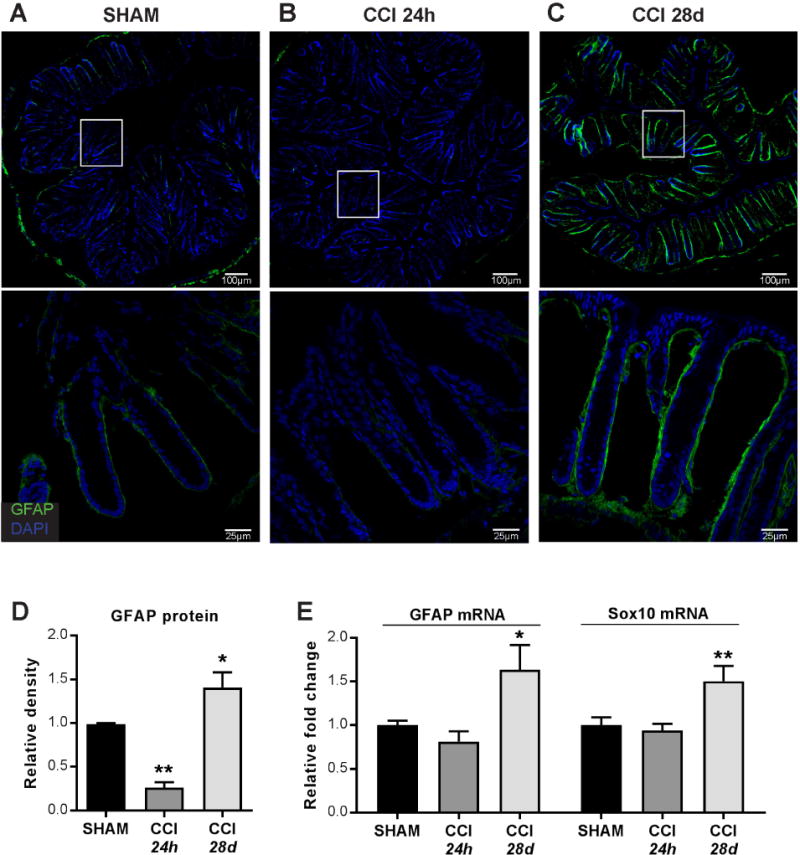
Figure 3. Enteric glial cells in the colon are significantly altered after TBI.

(A–C) Representative immunofluorescent staining and microscopy of glial cells in colons. (D) Mucosal GFAP+ quantification by integrated density. (E) GFAP and Sox10 mRNA expression in colon whole tissue isolates. Images (A–C, top) acquired with a 20× objective. Images (A–C, bottom) acquired with a 63× objective. Values (D–E) are means ± SEM, relative to shams; **P<0.01, compared to sham; *P<0.05, compared to sham; n=5–8.
