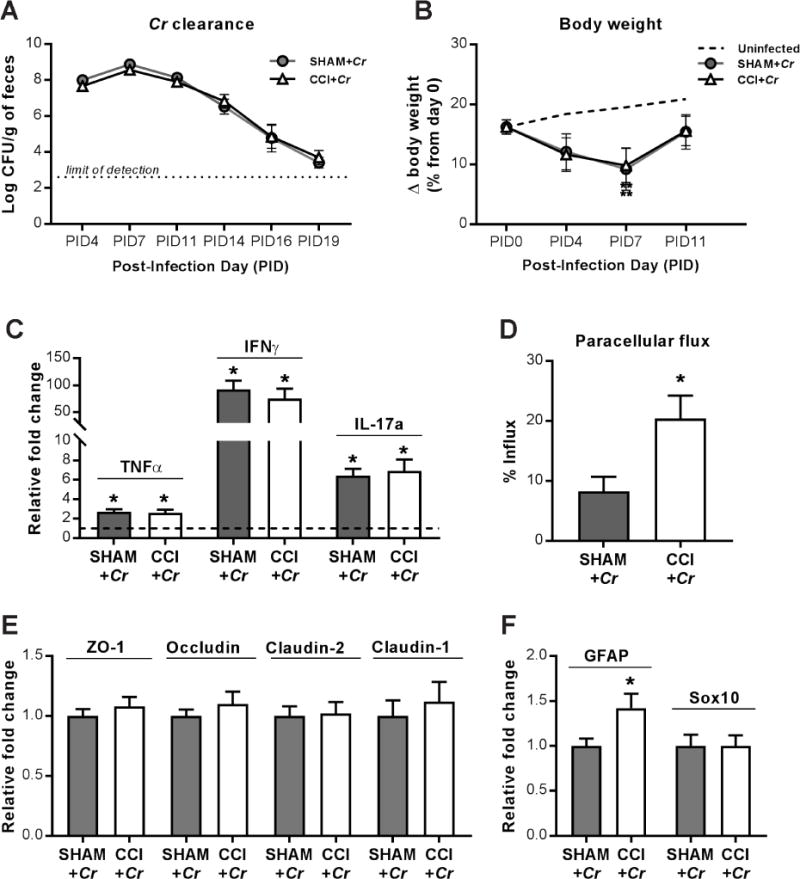
Figure 4. Host response and mucosal homeostasis after enteric Cr infection during the chronic phase of TBI.

(A) The kinetics of fecal Cr excretion were monitored over time until samples reached the limit of detection (dotted line). (B) Body weight over time, on day 28 after CCI (PID0), and post-infection days (PID) 4, PID7, and PID11. Percent change in body weight relative to day 0 (day of CCI or sham injury). Changes in body weight between uninfected sham and uninfected CCI groups between day 0 and PID12 were identical and combined as a point of reference (dashed line).**P<0.01 relative to uninfected animals. (C) Th1/Th17 cytokine upregulation in colons on PID12, relative to uninfected counterparts (dashed line at y=1). Mean relative fold change is 1.0 for uninfected sham and uninfected CCI. Sham SEM for TNFα: 0.29, IL-1β: 0.09, IFNγ: 0.16, IL-17a: 0.24; CCI SEM for TNFα: 0.25, IL-1β: 0.21, IFNγ: 0.27, IL-17a: 0.24; *P<0.05, relative to respective uninfected control; n=8-10. (D) Mucosal paracellular flux of 3K dextran in Cr-infected colons on PID12. (E) ZO-1, occludin, claudin-2, and claudin-1 mRNA expression in Cr-infected colons on PID12. (F) GFAP and Sox10 mRNA expression in Cr-infected colons on PID12. Values (D–F) are means ± SEM; *P<0.05, relative to Sham+Cr; n=10.
