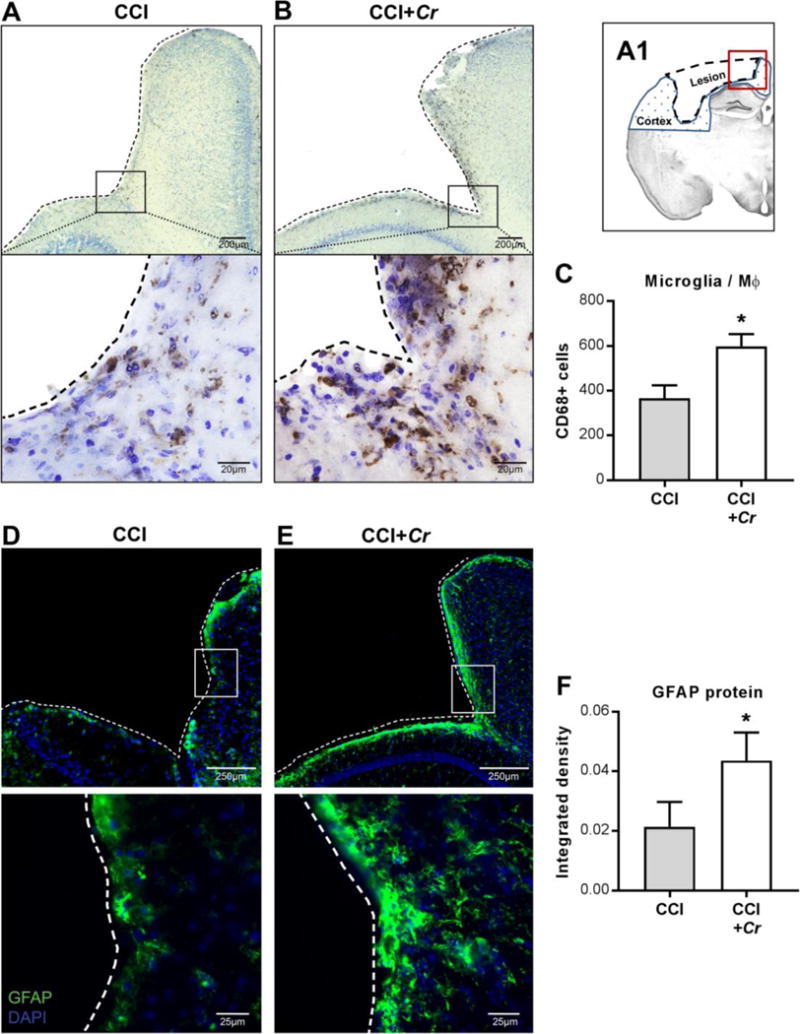
Figure 7. Exacerbation of TBI-induced microglia/macrophages and astrocyte activation in brains after enteric Cr infection.

(A1) Schematic representation of a coronal section of the injured brain, illustrating the lesion site (dashed outline), the ipsilateral cortex (blue dotted fill), and the perilesional area depicted in the following images (red square). (A–B) Representative images of 60 μm brain sections stained for the microglia/macrophage activation marker CD68 taken with 20× (upper panels) and 63× (lower panels) objectives. Black squares in upper panels indicate the regions used for high-magnification images. Dashed tracings indicate lesion perimeter. (C) Perilesional CD68+ cells in ipsilateral cortex of injured brains after CCI+Cr compared to CCI alone. Values are means ± SEM; *P<0.05, compared to CCI; n=8–10. (D–E) Representative images of 20 μm brain sections stained for the activated astrocyte marker GFAP taken with 20× (top) and 63× (bottom) objectives. White squares in upper panels indicate the regions used for high-magnification images. Dashed tracings indicate lesion perimeter. (F) GFAP+ density in ipsilateral cortical hemispheres of injured brains after CCI+Cr compared to CCI alone. Values are means ± SEM; *P<0.05; n=8–10.
