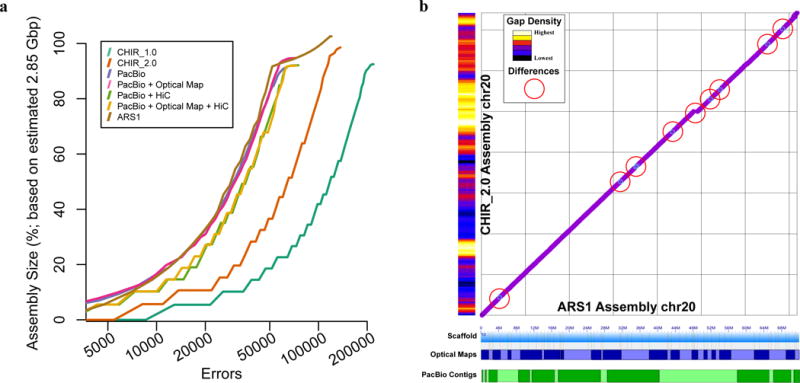
Figure 2.

Assembly benchmarking comparisons reveal high degree of assembly completion. (A) Feature response curves (FRC) showing the error rate as a function of the number of bases in each assembly (CHIR_1.0, CHIR_2.0, and ARS1) and each scaffold test (intermediary assemblies using a combination of Hi-C and Bionano scaffolding). (B) Comparison plots of chromosome 20 sequence between the ARS1 and CHIR_2.0 assemblies reveal several small inversions (light blue circles) and a small insertion of sequence (break in continuity) in the ARS1 assembly. Red circles highlight 9 of the aforementioned inversions and the insertion of sequence in our assembly. The ARS1 assembly contains only 10 gaps on this chromosome scaffold whereas CHIR_2.0 has 5,651 gaps on the same chromosome assembly (gap density histogram on the Y axis). ARS1 optical map scaffolds and Pacbio contigs represented on the X axis as alternating patterns of blue and green shades, respectively, showing the tiling path that comprises the entire single chromosome scaffold.
