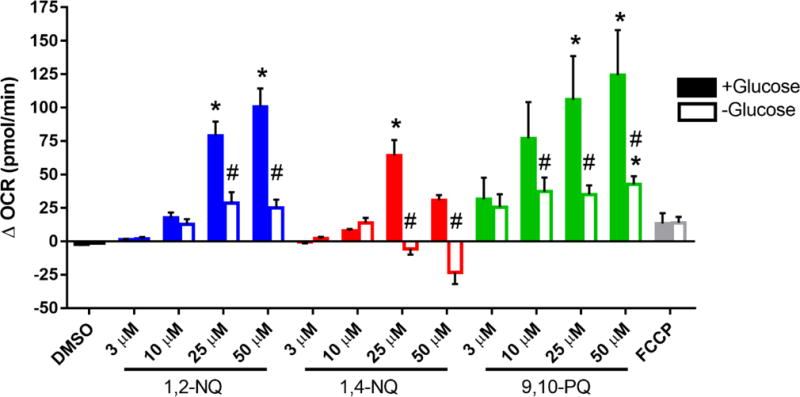
Figure 4. Glucose starvation blunts quinone-induced increase in OCR.

BEAS cells were starved of glucose (open bars) or provided with 10 mM glucose (closed bars) 2 hours prior to start of assay. BEAS cells were treated with DMSO (vehicle), the indicated concentrations of 1,2-NQ, 1,4-NQ, 9,10-PQ, BQ, or 0.25 uM FCCP following a baseline OCR collection period of 18 min on the extracellular flux analyzer. Shown is the change in OCR relative to basal value, * indicates the compound-induced OCR was significantly (p<0.05) different from baseline OCR. # indicates a significant (p<0.05) difference between glucose starved and supplemented groups. Data displayed as mean +/− SEM. For DMSO, 1,2-NQ and 1,4-NQ, n ≥ 4. For 9,10-PQ and FCCP, n = 3.
