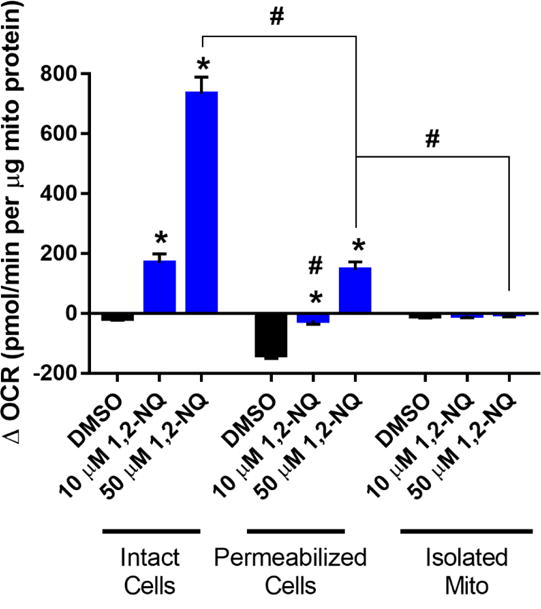
Figure 6. Mitochondrial preparations show a diminished 1,2-NQ-induced OCR increase.

All values shown as a change from basal OCR observed immediately after addition of DMSO or the indicated concentration of 1,2-NQ. All values were normalized to the mass of mitochondrial protein in each preparation. * indicates the change in OCR was significantly (p<0.05) different from DMSO treatment within each preparation. # indicates the change in OCR was statistically different (p<0.05) between mitochondrial preparations. For intact cells, n ≥ 11; for permeabilized cells, n ≥ 13; for isolated mitochondria, n = 5. Data shown as mean +/− SEM.
