
Figure 1.
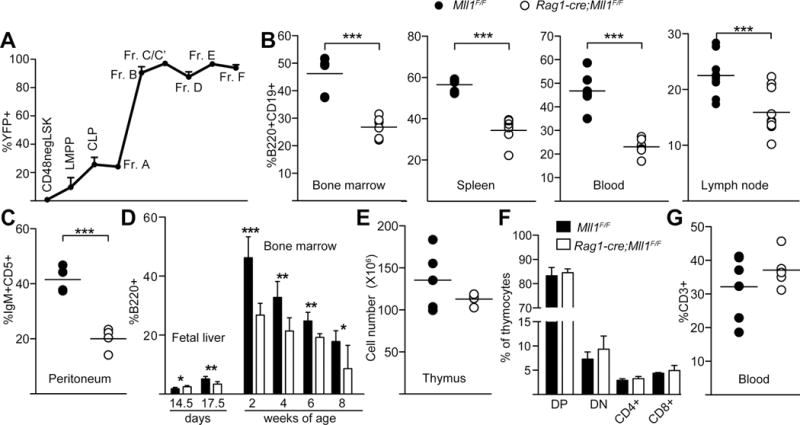
Lymphocyte specific deletion of Mll1 reduces B cell but not T cell numbers. A) Analysis of yellow fluorescent protein (YFP) expression as a read-out for cre activity during B-lymphopoiesis. The YFP+ percentage within progenitor or B cell populations from three Rag1-cre;RosaYFP reporter animals was determined by flow cytometry and average % YFP is shown. Populations are defined in the Methods. Error bars reflect 95% confidence intervals (CI), n=4–10 animals per genotype. B–C) Percent of B-cells in bone marrow and peripheral organs. Black circles represent control littermates and open circles are Rag1-cre;Mll1F/F animals, which were 2–3 weeks of age for most populations and 3–4 weeks of age for lymph node and peritoneum. Student’s t-tests were applied to determine significance; ***p< 0.001. D) Age dependence of B-cell reduction as measured by the fraction of B220+ cells in the indicated embryo or adult organs; n=3–6 animals per age/genotype, *p<0.05, **p<0.01, ***p< 0.001. Embryonic days or post-natal weeks are indicated under the graph. E–G) Total thymocyte numbers, subpopulations of thymocytes, and peripheral blood T-cells, n=4–10 animals per genotype. Double positive (DP), double negative (DN) and single positive CD4+ and CD8+ are shown, as well as the T-cell percentage (CD3+) in the peripheral blood. Black bars or circles represent control Mll1F/F littermates and open bars or circles are Rag1-cre;Mll1F/F animals.