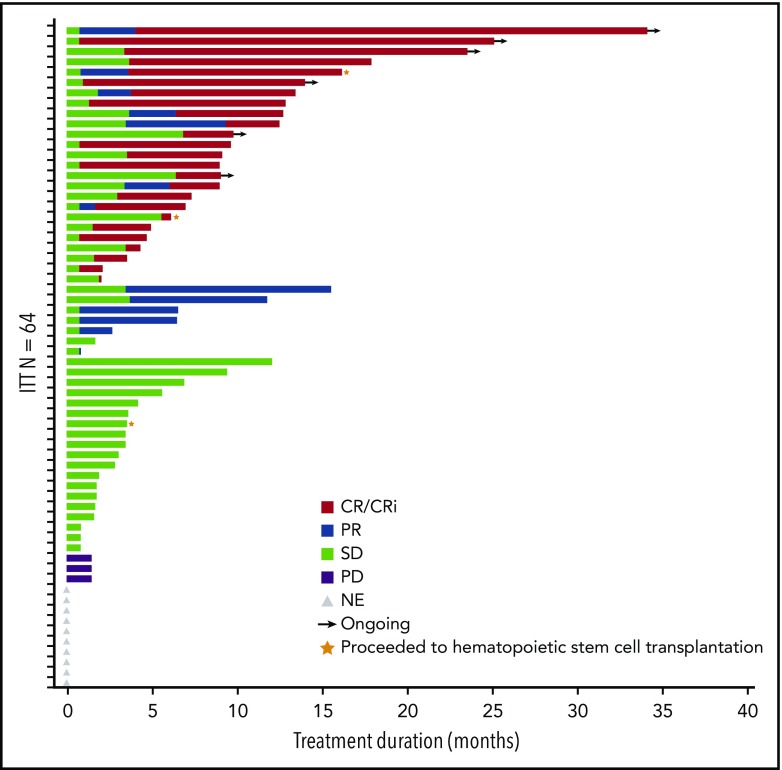
Figure 2.
Duration of response. Bar length reflects duration of response. End of duration is due to progressive disease (PD), last disease assessment, or last follow-up. Gray triangles indicate the 10 patients who did not have postbaseline disease assessment and are listed as not evaluable (NE) but included as “nonresponders” in the ITT analysis. SD, stable disease.

