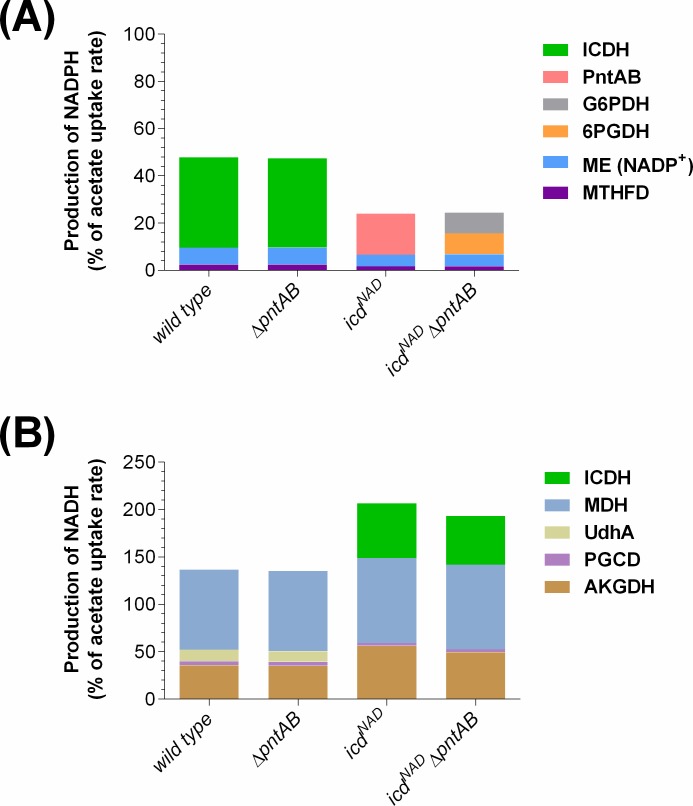
Fig 3. Contribution of different sources to the total production of NADPH and NADH in the studied strains.
The flux of production of (a) NADPH and (b) NADH is shown as a percentage of the corresponding acetate uptake rate. The reactions that contribute to the respective cofactor production are detailed. The values were obtained from the optimal flux distribution simulated for each strain used in this work. ICDH: isocitrate dehydrogenase; PntAB: membrane-bound transhydrogenase; G6PDH: glucose 6-phosphate dehydrogenase; 6PGDH: 6-phosphogluconate dehydrogenase; ME: malic enzyme; MTHFD: methylenetetrahydrofolate dehydrogenase; MDH: malate dehydrogenase; UdhA: soluble transhydrogenase; PGCD: phosphoglycerate dehydrogenase; AKGDH: α-ketogluconate dehydrogenase.

