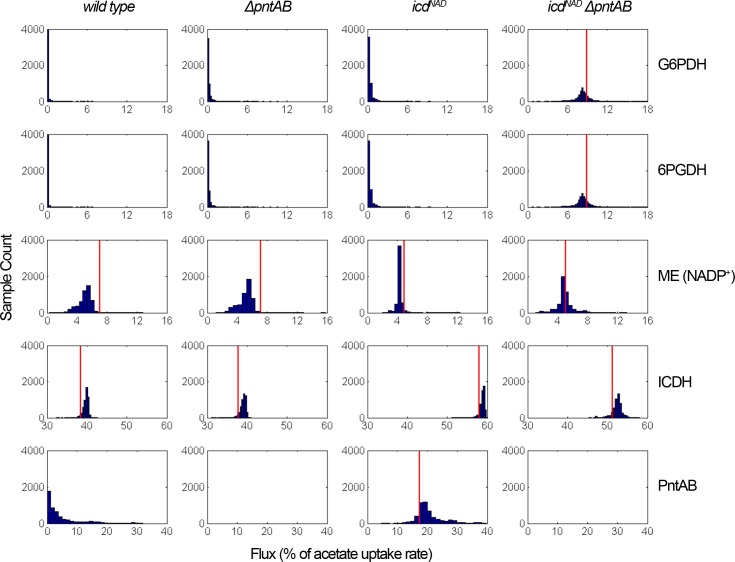
Fig 4. Histograms of sampled fluxes of the main sources of NADPH.
Distribution of sampled points from the solution space of each strain under sub-optimal conditions of growth. The histograms of the main sources of NADPH are shown (G6PDH: glucose 6-phosphate dehydrogenase; 6PGDH: 6-phosphogluconate dehydrogenase; ME: malic enzyme; ICDH: isocitrate dehydrogenase; PntAB: membrane-bound transhydrogenase). Simulations were performed using the physiological parameters and a 90% of each growth rate to model the sub-optimal conditions. Also, if the optimal flux was not zero, vertical red lines indicate this value.

