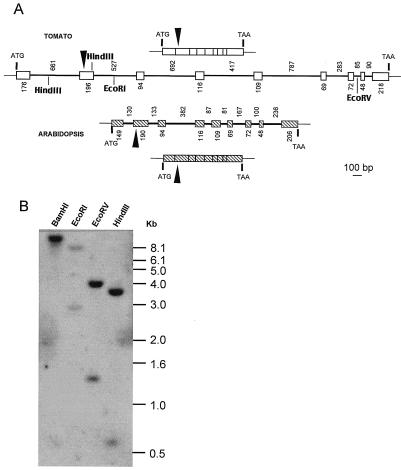
Figure 4.
Genomic organization of PTOX from tomato and Arabidopsis. A, Schematic representation of cDNAs and genomic fragments from PTOX. Upper and lower lines represent transcripts, whereas intermediate lines represent genomic structures. Exons are indicated by boxes, introns by lines. Numbers indicate the length in base pairs of exons (below) and introns (above). Transcription start site (ATG) and stop codon (TAA) are indicated. Putative processing site of the targeting sequence is indicated with a black arrowhead. Cleavage sites for restriction enzymes used in B are shown for the tomato gene. B, Southern-blot analysis of tomato PTOX. Tomato DNA was digested with the indicated restriction endonucleases and hybridized with the radiolabeled tomato full-length cDNA probe. Size markers (kilobase pairs) are indicated on the right.

