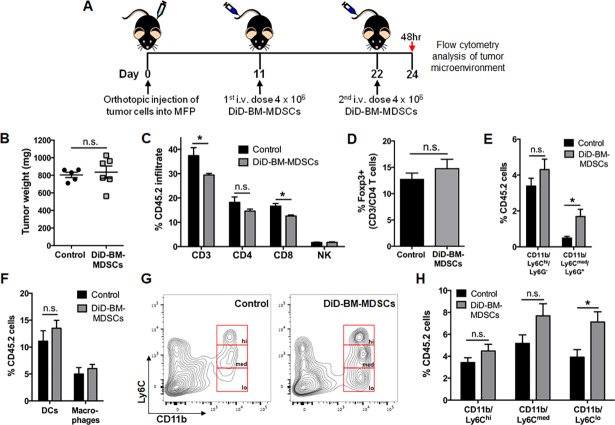
Fig 5. Breast tumor microenvironment dynamics after adoptive transfer of DiD-BM-MDSCs.
A) Schematic of treatment regimen for TME analysis after adoptive transfer of DiD-BM-MDSCs into tumor-bearing mice. Mice were injected with PyMT-WT cells into the MFP on day 0, and i.v. injected with 4x10⁶ DiD-BM-MDSCs on day 11 and 22. Tumors were analyzed by flow cytometry 48 hours (day 24) after the second dose of DiD-BM-MDSCs. PyMT-WT tumor-bearing mice were used as controls (control n = 5; DiD-BM-MDSC n = 6 for all analyses). B) Tumor weight at time of flow cytometry analysis at day 24. C) Flow cytometry analysis of CD3 lymphocytes, CD3/CD4 and CD3/CD8 T cells, as well as CD3-/NK1.1+ NK cells within the tumor at day 24. D) Flow cytometry analysis of the percentage of Foxp3+ cells within the CD3/CD4 T cell population at day 24. E) Flow cytometry analysis of CD11b/Ly6C/Ly6G myeloid populations as a percentage of CD45.2+ cells within the tumor at day 24. F) Flow cytometry analysis of DCs (CD11c/MHC Class II) and macrophages (CD11b/F480/MHC Class II) as a percentage of CD45.2+ cells within the tumor at day 24. G) Representative flow cytometry plots of CD11b/Ly6C populations (hi = high, med = medium and lo = low) within the CD45.2+ population in the tumor at day 24 and quantified in H. Data represented as mean ± SEM. *p<0.05; n.s. not significant.

