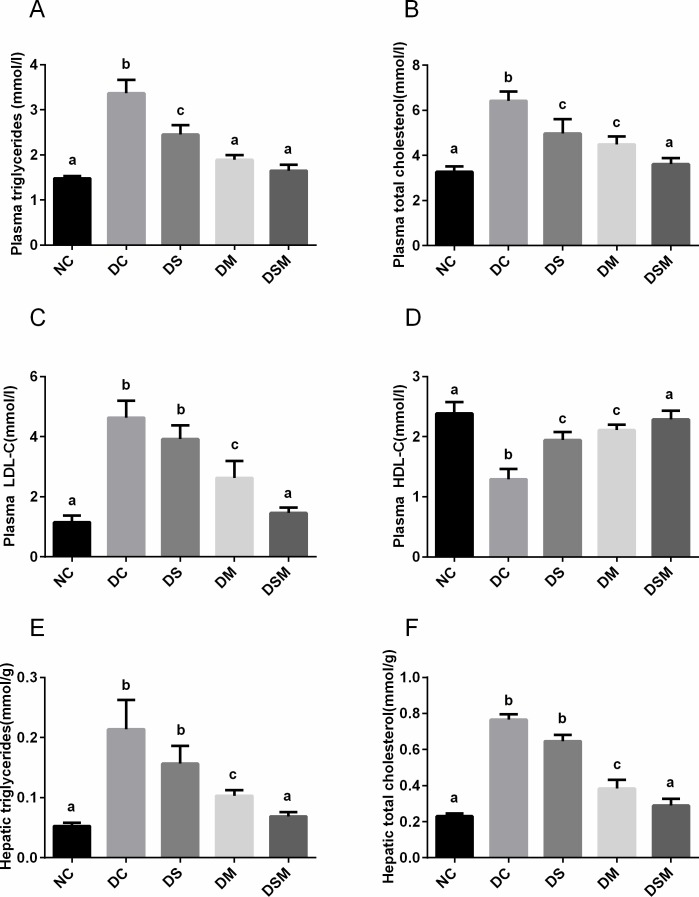
Fig 2. Swimming plus metformin intervention sharply ameliorates lipid metabolism in GDM.
(A) Murine plasma TG levels in different groups. (B) Murine plasma TC levels in different groups. (C) Murine plasma LDL-C levels in different groups. (D) Murine plasma HDL-C levels in different groups. (E) Effects of various interventions on TG levels in the murine livers. (F) Effects of various interventions on TC levels in the murine livers. The values represent the mean ± SEM, n = 10/group. The columns with different letter (a, b, c) are significantly different, P<0.05 (ANOVA, SNK). All data in this figure are representatives of three independent experiments. NC: normal control group, DC: GDM control group, DS: GDM treated with swimming group, DM: GDM treated with metformin group, DSM: GDM treated with swimming plus metformin group.

