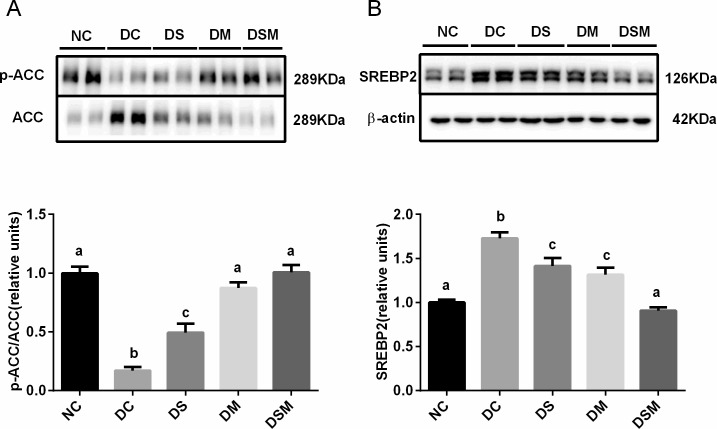
Fig 4. Combined intervention of swimming plus metformin ameliorates the hepatic de novo lipogenesis under GDM condition.
(A) Levels of phosphorylated ACC were normalized to total ACC in the livers treated with swimming or metformin or both combined. (B) Expression of SREBP2 were normalized to β-actin in the livers intervened by swimming or metformin or both combined. The values represent the mean ± SEM, n = 10/group. The columns with different letter (a, b, c) are significantly different, P<0.05 (ANOVA, SNK). All data in this figure are representatives of three independent experiments. NC: normal control group, DC: GDM control group, DS: GDM treated with swimming group, DM: GDM treated with metformin group, DSM: GDM treated with swimming plus metformin group.

