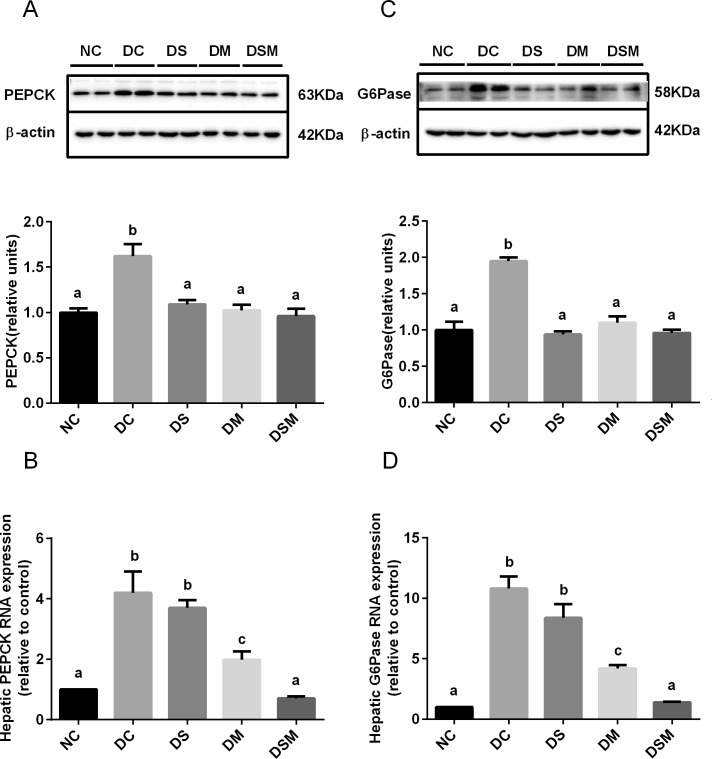
Fig 5. Combined intervention of swimming plus metformin suppresses hepatic gluconeogenesis under GDM condition.
(A) Protein expression of PEPCK in the livers from the mice in NC, DC, DS, DM and DSM groups, respectively. Results were normalized to β-actin and the fold change was calculated relative to DC group. (B) mRNA levels of PEPCK in the same livers in (A). (C) Protein expression of G6Pase in the livers from the mice in NC, DC, DS, DM and DSM groups, respectively. Results were normalized to β-actin and the fold change was calculated relative to DC group. (D) mRNA levels of G6Pase in the same livers in (C). mRNA levels were normalized to β-actin. The values represent the mean ± SEM, n = 10/group. The columns with different letter (a, b, c) are significantly different, P<0.05 (ANOVA, SNK). All data in this figure are representatives of three independent experiments. NC: normal control group, DC: GDM control group, DS: GDM treated with swimming group, DM: GDM treated with metformin group, DSM: GDM treated with swimming plus metformin group.

