FIGURE 5:

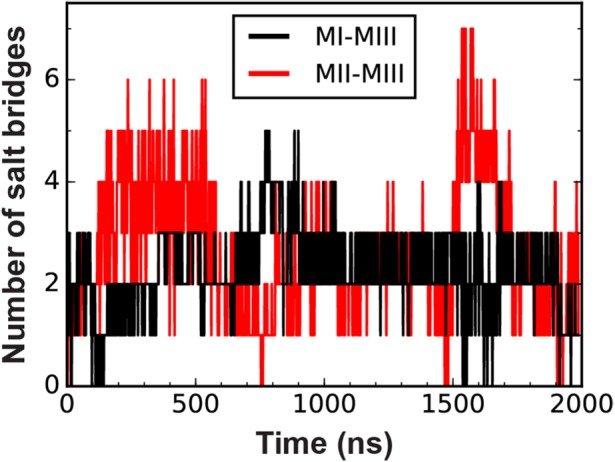
Salt bridges at interdomain interfaces in the α-catenin M domain. Traces indicate the number of salt bridges between MIII and either MI or MII during the 2-μs constant-force SMD simulation of the α-catenin M domain.

Salt bridges at interdomain interfaces in the α-catenin M domain. Traces indicate the number of salt bridges between MIII and either MI or MII during the 2-μs constant-force SMD simulation of the α-catenin M domain.