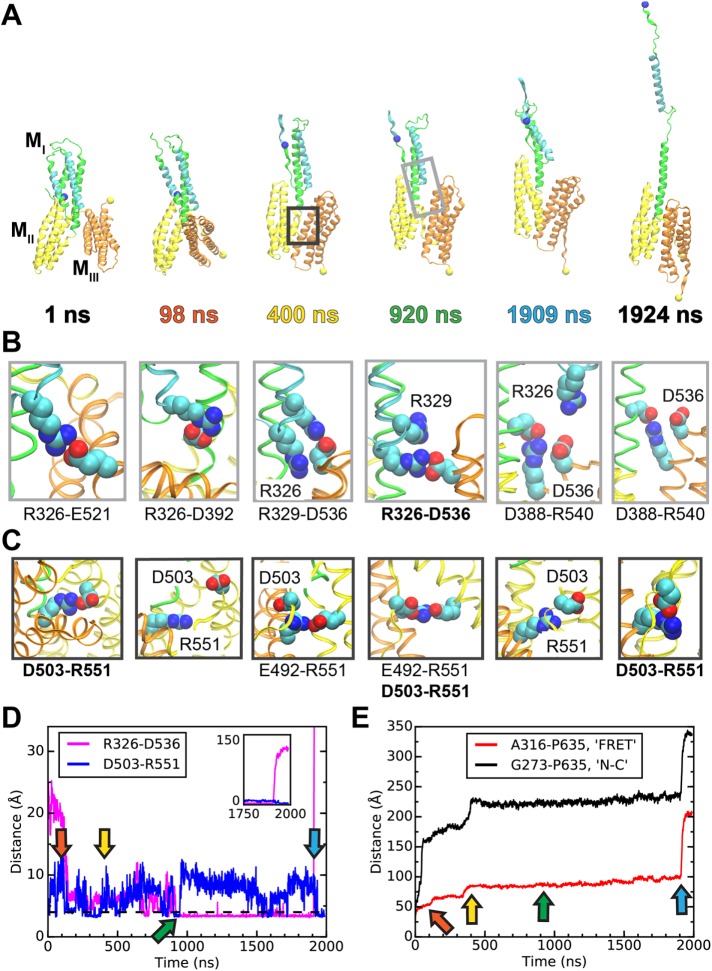
FIGURE 6:
Simulated unfolding of WT α-catenin under constant force. (A) Snapshots of α-catenin conformations at selected time points during a 2-μs SMD simulation of WT α-catenin M domain subject to a constant force of 100 pN. (See Supplemental Movie S1 for the entire trajectory.) Unraveled N-terminal helices are not shown for clarity. The light or dark gray box in the snapshot at 920 or 400 ns indicates a typical inset for the MI-MIII or MII-MIII interface, shown in B or C, respectively. (B, C) Insets showing salt bridges at interdomain interfaces at the simulation time points corresponding to the snapshots in A. (B) Salt bridges involving R326 at the MI-MIII interface of α-catenin. (C) Salt bridges involving R551 at the MII–MIII interface of α-catenin. (D, E) Evolution of distances between selected pairs of residues as a function of simulation time. Arrows indicate time points of snapshots in A–C. (D) D503-R551 is an interdomain salt bridge between MII and MIII; R326–D536 is a force-bearing contact between MI and MIII. (E) A316 and P635 are located near the ECFP and YPet of the α-catenin conformation sensor and are represented in A as blue and yellow spheres, respectively. G273 and P635 are the N- and C-terminal residues, respectively, of the M domain.

