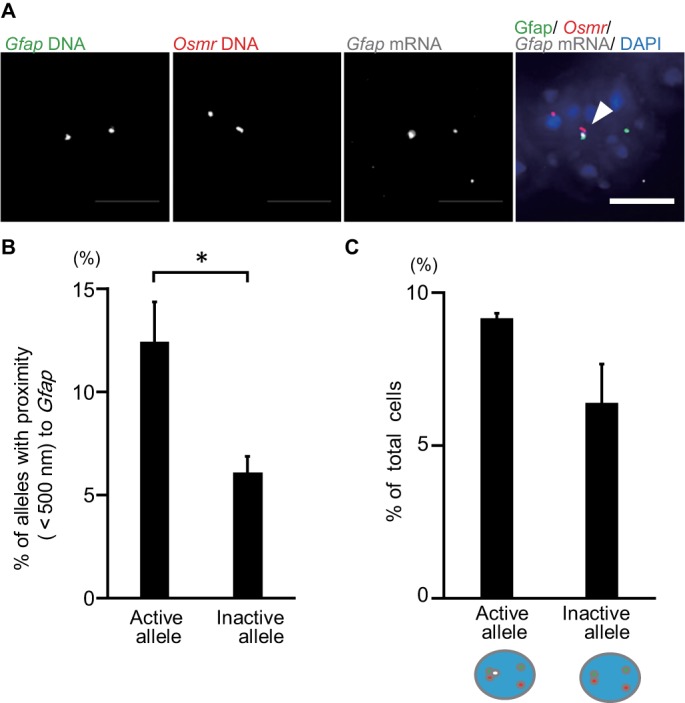
FIGURE 3:

Gfap and Osmr gene clustering correlates with Gfap transcription in LIF-stimulated cells. (A) Projected images of triple-labeled RNA/DNA FISH in LIF-stimulated cells for Gfap DNA (green), Osmr DNA (red), and Gfap RNA (white). Nuclei were counterstained with DAPI (blue). Scale bar = 5 µm. Arrowhead indicates clustering alleles. (B) Clustering frequencies of Gfap active (transcribed) and inactive (not transcribed) alleles determined using RNA/DNA FISH for LIF-stimulated cells. Data represent the means ± SEM of three biological replicates (n = 72–74 for active alleles and 332–336 for inactive ones). Student’s t test was performed for statistical analysis. *p < 0.05. (C) Phenotypic analysis of cells with single active (transcribed) Gfap. Frequencies of cells with an active or inactive Gfap allele that clustered with Osmr were determined. Data are presented as the means ± SEM of three biological replicates (n = 54–55). Student’s t test was performed.
