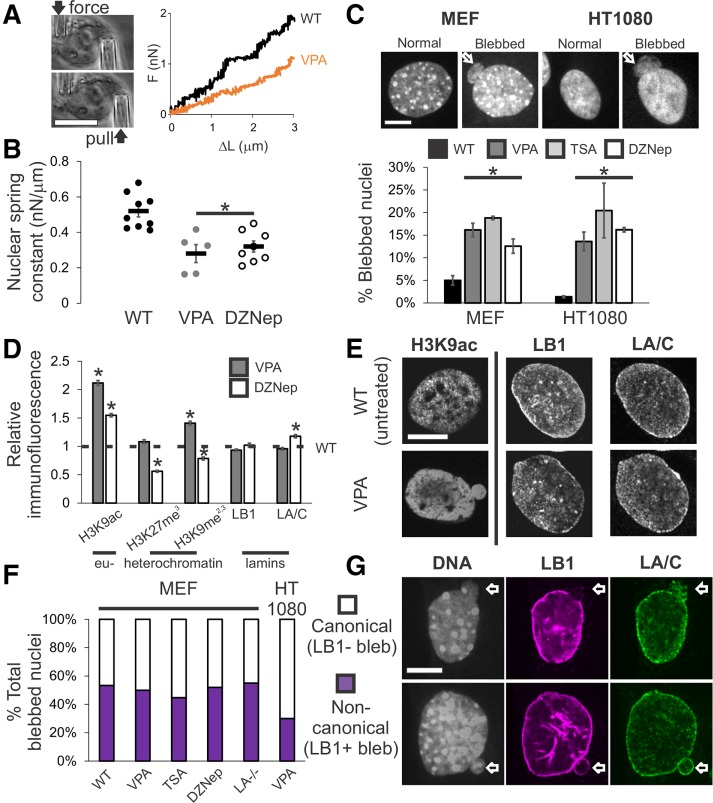
FIGURE 1:
Increased euchromatin via HDACi or decreased heterochromatin via HMTi weakens nuclear rigidity and induces nuclear blebs, independent of changing lamin content and distribution. (A) Representative images of the micromanipulation force measurement technique and force-extension plot. Micromanipulation of a single isolated nucleus measures extension of the whole nucleus via movement of the “pull” pipette while simultaneously measuring force via the deflection of the “force” pipette with a known spring constant. (B) Nuclear spring constant, measured as the slope of the force-extension trace (nN/µm), for the chromatin-dominated initial force-extension regime (<3 µm) for MEF V–/– nuclei untreated (WT, n = 9), increased euchromatin (VPA, n = 5), and decreased heterochromatin (DZNep, n = 8). (C) Representative images of normal and blebbed nuclei for MEF and HT1080 cells. White arrow denotes bleb. Percentages of blebbed nuclei in untreated (WT, black), increased euchromatin (VPA, gray and TSA, light gray), and decreased heterochromatin (DZNep, white; three data sets, total n > 400 for each condition) after 16–24 h of treatment. (D) Relative intensities of euchromatin (H3K9ac), heterochromatin (H3K27me3 and H3K9me2,3), and lamins B1 and A/C measured via immunofluorescence relative to untreated (WT = 1 denoted by black dotted line), for VPA- and DZNep-treated MEFs (n > 90 for each). Western blots confirm immunofluorescence measurements (Supplemental Figure 4, A and B). (E) Representative immunofluorescence images of euchromatin (H3K9ac), lamin B1, and lamin A/C in untreated (WT) and VPA-treated MEFs. (F) Percentages of MEF wild-type (WT), VPA, TSA, DZNep, lamin A null (LA–/–), and HT1080 VPA-induced blebbed nuclei displaying canonical absence (white) or noncanonical presence (purple) of lamin B1 staining in the blebs (n = 15, 66, 38, 27, 20, and 30 respectively). (G) Representative images of MEF nuclei stained for DNA with Hoechst (gray), lamin B1 (purple), and lamin A (green) via immunofluorescence. Examples of canonical blebs (top) lack lamin B1 and display distended lamin A, while noncanonical blebs (bottom) show no change in lamin B1 or A in the bleb. Scale bar = 10 μm. Error bars represent standard error. Asterisk denotes statistically significant difference (p < 0.01).

