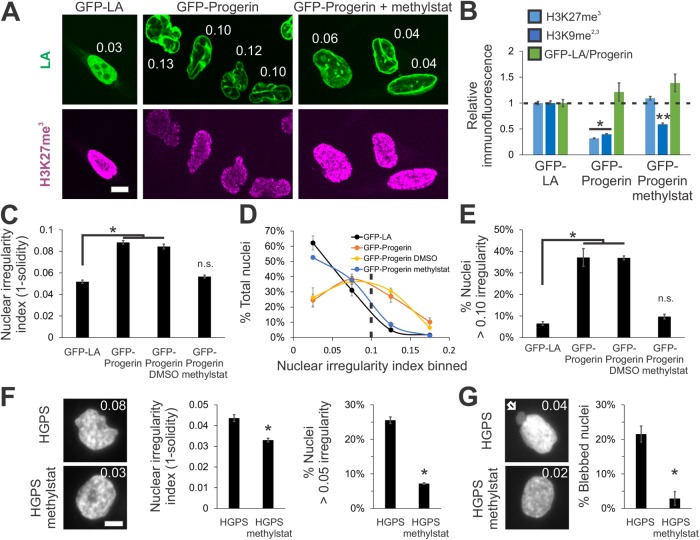
FIGURE 4:
Increased heterochromatin via methylstat treatment rescues nuclear morphology in a model cell line and patient cells of laminopathy/aging disease HGPS caused by mutant lamin A. (A) Representative images of fluorescently tagged lamin A/progerin (green) and heterochromatin marker (H3K27me3, magenta) in HeLa nuclei expressing GFP-lamin A, GFP-progerin (GFP-LAΔ50), and GFP-progerin with methylstat for 48 h. White numbers denote nuclear irregularity index of the corresponding nucleus (1 – s, where s = solidity = area/convex area). (B) Relative immunofluorescence for heterochromatin markers H3K27me3 and H3K9me2,3 (blue; n = 148 and 141, 135 and 146, and 126 and 104, respectively). (C–E) Plots of (C) average nuclear irregularity index, (D) histogram of nuclear irregularity index, and (E) average percentage of cells with irregularly shaped nuclei, which have irregularity index greater than 0.10 (HeLa GFP-LA n = 387, two data sets; HeLa GFP-progerin n = 656, three data sets; HeLa GFP-progerin DMSO n = 341, two data sets; HeLa GFP-progerin methylstat n = 496, two data sets). HeLa wild-type and HeLa GFP-LA nuclei have a similar average nuclear irregularity index (Supplemental Figure 3C). (F, G) HGPS passage 26 patient fibroblast cells untreated or treated with 2 μM methylstat for 48 h and measured for (F) nuclear irregularity index and (G) nuclear blebbing (two data sets, n = 130 and 139, respectively). Representative images have a white number denoting respective nuclear irregularity index and white arrow denotes nuclear bleb. Graphing nuclear irregularity index percentages >0.05 was chosen because HGPS nuclei are more circular than HeLa nuclei. Scale bar = 10 μm. Error bars represent standard error. Asterisk denotes statistically significant difference (p < 0.01), where n.s. indicates no significant difference from control. Different numbers of asterisks are also significantly different.

