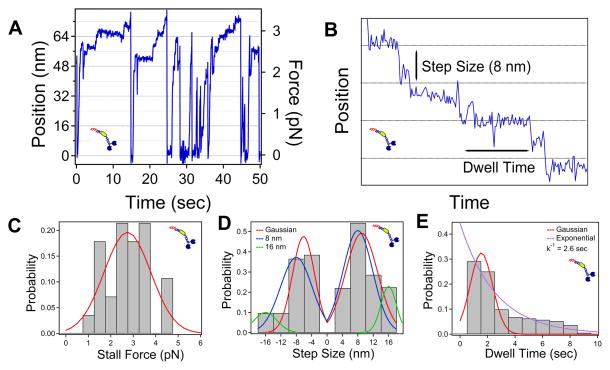
Figure 2. Kif15 Motility Assay.
(A) Example Kif15 motility trace. (B) Example of 8 nm stepping used for step size and dwell time analysis. (C) Stall force histogram, averaging 2.7 pN ± 1.0 pN (N=27). (D) Step size, averaging 8.9 nm ± 4.1 nm (N=118, forward) and 6.1 nm ± 2.9 nm (N=52, backward). 8 nm (blue) and 16 nm (green) constrained fits. (E) Dwell time, averaging 1.5 sec ± 0.8 sec. Decay constant (exponential fit, purple) is 2.6 sec. See also Movie S2.

