
Fig. 3.
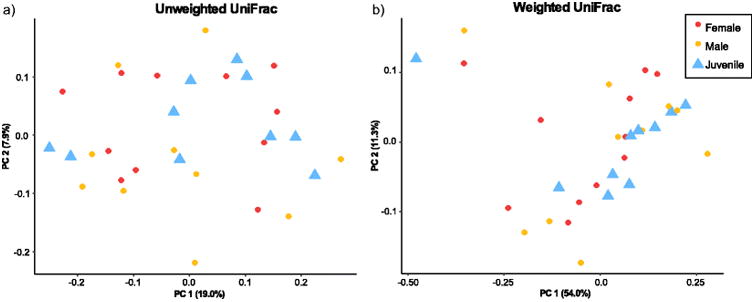
Principal coordinates showing patterns of beta diversity between life history stages. a) Weighted UniFrac and b) Unweighted UniFrac. Unweighted UniFrac and Bray-Curtis analyses showed similar patterns, so Bray-Curtis are not shown.
Official websites use .gov
A
.gov website belongs to an official
government organization in the United States.
Secure .gov websites use HTTPS
A lock (
) or https:// means you've safely
connected to the .gov website. Share sensitive
information only on official, secure websites.
Principal coordinates showing patterns of beta diversity between life history stages. a) Weighted UniFrac and b) Unweighted UniFrac. Unweighted UniFrac and Bray-Curtis analyses showed similar patterns, so Bray-Curtis are not shown.