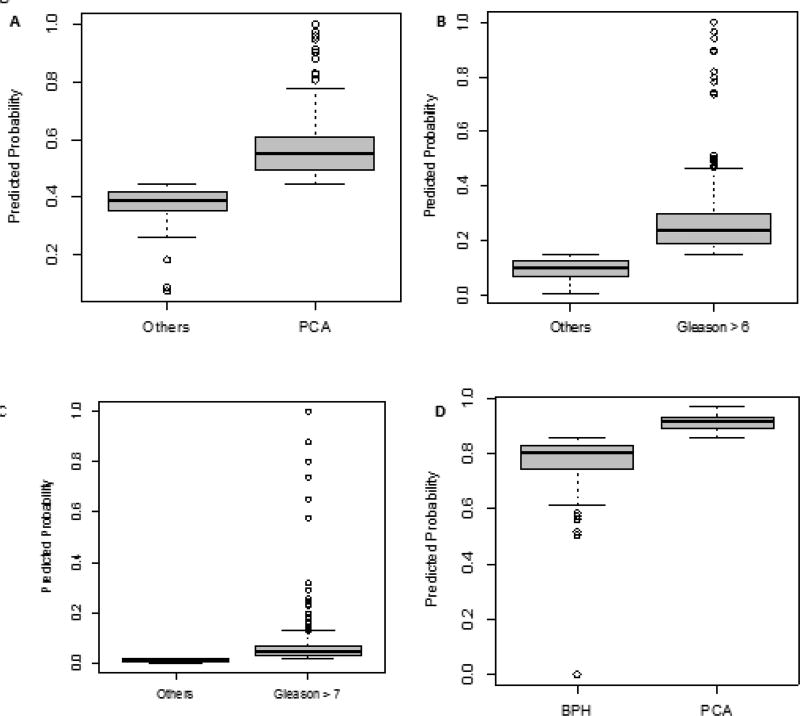
Figure 2. Predicted probability distributions plotted for each ROC analysis.
1A) Distribution of predicted probabilities for patients with or without PrCa. 1B) Distribution of predicted probabilities for patients with high Gleason score (GS ≥ 7) disease. 1C) Distribution of predicted probabilities for patients with Gleason score ≤ 6. 1D) Distribution of predicted probabilities for patients with benign prostatic hyperplasia or PrCa.

