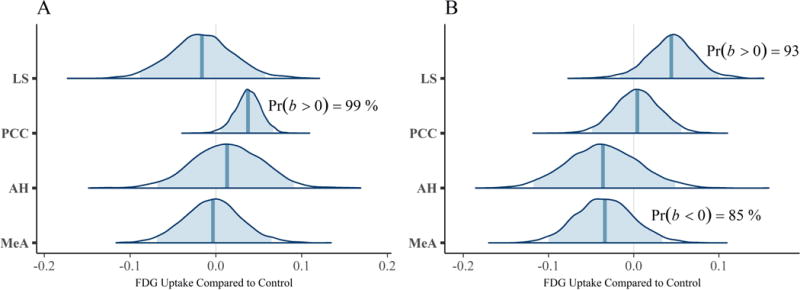
Figure 3.

Posterior distributions from the multivariate multilevel mate guarding model. The density plots are the parameter estimates (contrasts from the control group). The shaded blue regions are the 95% credible regions, while the dark blue lines are the point estimates. Panel A: left ROIs. Panel B: right ROIs.
