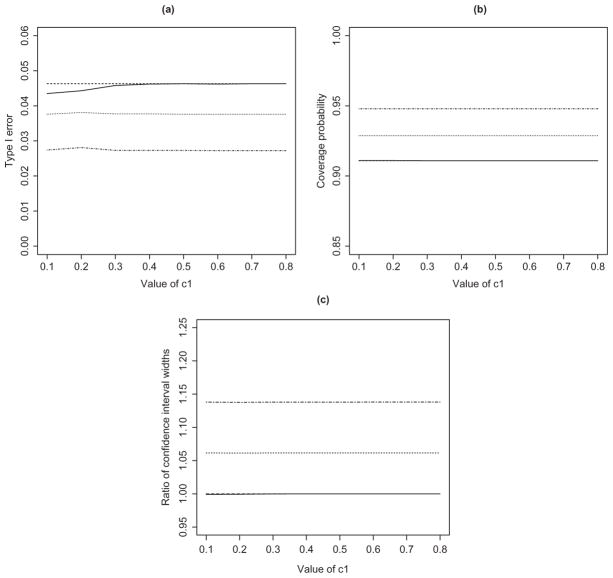
Figure 1.
Simulation results under the null hypothesis: (a) type I error of the equivalence test; (b) coverage probability of the 90% confidence interval; and (c) ratio of the widths of the confidence intervals with versus without the prior evidence. The solid, dashed, dotted, and dot-dashed curves pertain to , α1 = 0, α1 = 0.2α, and α1 = 0.4α, respectively. The solid and dashed curves are indistinguishable.

