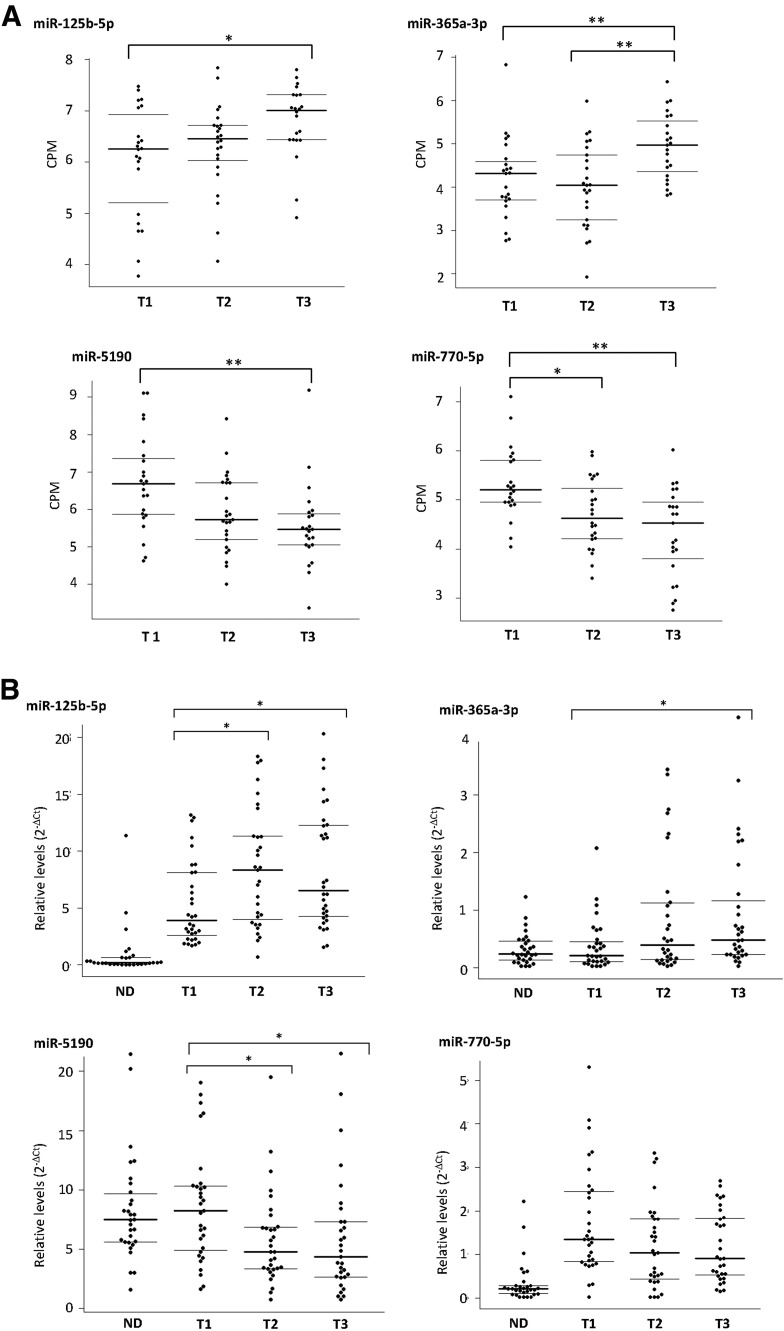
Figure 2.
A: Distribution of concentration of four candidate miRNAs according to tertiles of HbA1c in the screening panel of T1D patients. The plasma concentration of the candidate miRNAs was measured by HTG platform and is expressed as CPM with quantile normalization. The HbA1c tertile cut points were as follows: tertile 1 (T1), HbA1c <8.1%; tertile 2 (T2), 8.1 ≤ HbA1c ≤ 8.9%; and tertile 3 (T3), HbA1c >8.9%. B: Distribution of concentration of four candidate miRNAs according to tertiles of HbA1c in the replication panel of T1D patients and in control subjects without diabetes (ND). The plasma concentrations of the candidate miRNAs were measured by the qRT-PCR method and are expressed as levels relative to the average concentrations of all detected miRNAs. The HbA1c tertile cut points were as follows: T1, HbA1c <8.6%; T2, 8.6 ≤ HbA1c ≤ 9.7%; and T3, HbA1c >9.7%. Horizontal bars indicate median (bold) and first and third quartile in each group. Groupwise comparison between tertiles was assessed by Dwass-Steel-Critchlow-Fligner test. *P < 0.05, **P < 0.01.

