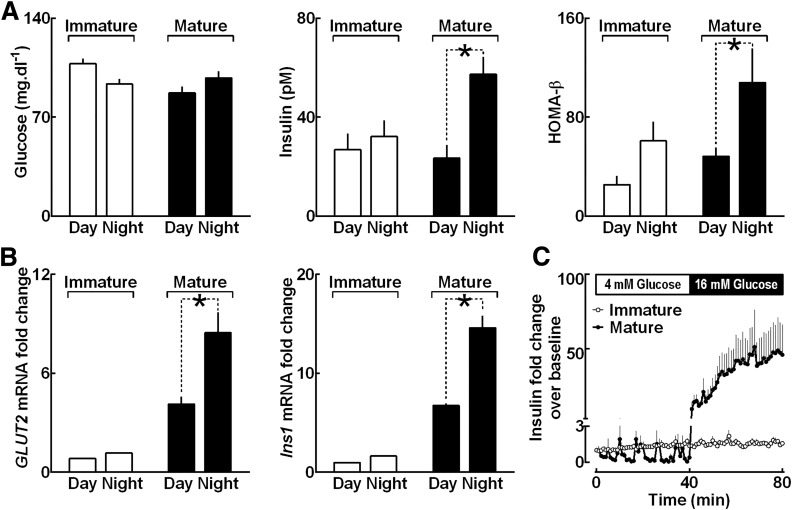
Figure 3.
Postnatal development of circadian variations of in vivo insulin secretion and clock-dependent mRNA expression in rat islets (A). Graphs showing diurnal differences in blood glucose, plasma insulin, and HOMA-β assessed in immature (10 days old) and mature (30 days old) rat pups. Each data point represents mean ± SEM (n = 6–10) (assumed to be statically significant at *P < 0.05). Day represents light phase 1000 h (ZT 4) and night 2200 h (ZT 16). B: Graphs showing Glut2 and Ins1 mRNA expression levels from whole islet lysates of immature (2–5 days old) and mature (30 days old) rat pups collected during the day (ZT 4–8) and at night (ZT 16–20). mRNA values from immature pups at daytime set as 1. Each data point represents mean ± SEM (n = 3–5) (assumed to be statically significant at P < 0.05). C: Graph showing data from in vitro islet perifusion in islets isolated from immature (2 days old) and mature (30 days old) rat pups expressed as mean ± SEM (n = 4–5 per group) insulin fold change over baseline profiles sampled at basal (4 mmol/L, 0–40 min) and stimulated (16 mmol/L, 40–80 min) glucose.

