Figure 7.
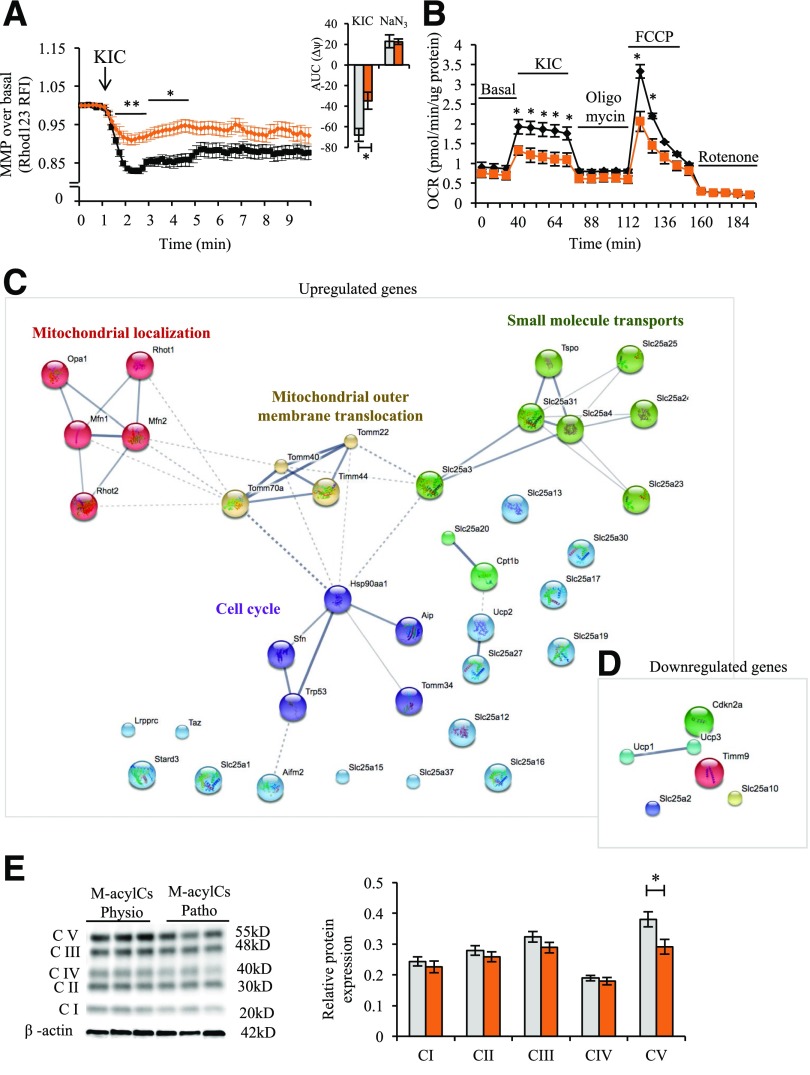
M-acylCs decrease mitochondrial complex V expression. KIC-stimulated MMP (n = 3 for M-acylCs Physio and n = 4 for M-acylCs Patho group) (A) and KIC-stimulated OCR (n = 3/group) (B) were measured in murine islets after 28-h treatment with M-acylCs. The area under the curve (AUC) is shown as an inset. Mitochondrial gene array was performed in murine islets treated with M-acylCs in vitro, and the genes upregulated (C) and downregulated (D) >1.2 times are shown in a cluster (n = 3/group). Protein expression of oxidative phosphorylation was evaluated in murine islets treated with M-acylCs in vitro and is presented as a representative Western blot of mitochondrial complex (E) and its quantification (n = 6/group). Data are presented as mean ± SEM. *P < 0.05, **P < 0.01. FCCP, carbonylcyanide-4-(trifluoromethoxy)-phenylhydrazone; RFI, relative fluorescence intensity.

